ResearchAnalysis
Developer tools drew half of all stated AI deal money from 9% of deals
We analysed 189 AI deals since January 2025. Developer tools took $76.3B of the $153.6B in stated prices, one deal is 39% of it, and only 16 prices came from the companies.
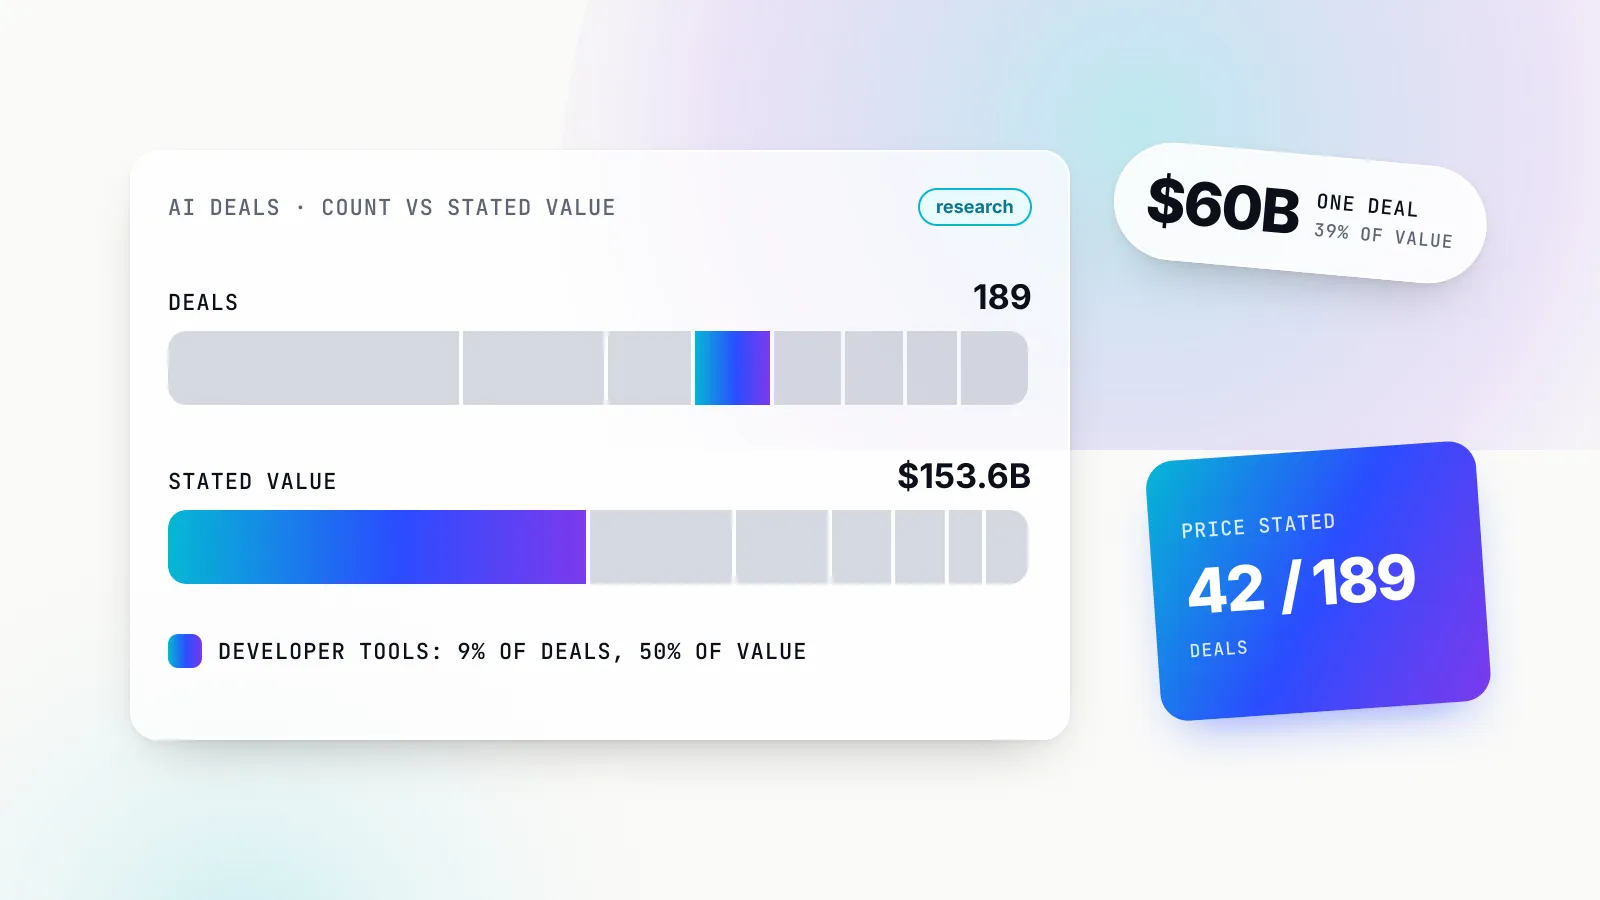
Half of all the money stated for AI acquisitions since January 2025 went to developer tools, a category that accounts for fewer than one deal in ten. In the 189 live deals in the GenAI Brief AI Acquisitions Tracker, developer-tools targets are 17 deals (9%) but $76.3B of the $153.6B in stated prices (49.6%), while application companies are 67 deals (35%) and only $4.4B (2.8%).
That inversion is the headline, but it is not the whole story. Most of it comes from one transaction, SpaceX’s purchase of Cursor, which on its own is 39.1% of every stated dollar. Strip it out and a second pattern appears underneath: the deals that move the most money are not conventional acquisitions at all, but licensing-and-hire arrangements struck exclusively by big tech. And the frontier labs, OpenAI above all, have become the most active buyers by count while disclosing almost nothing about what they pay.
This piece is for founders weighing an exit, corporate development teams benchmarking a deal, investors and builders trying to read where the money in AI tooling is going. Every number below is computed by a script from the public tracker, and the last sections explain exactly what the data can and cannot support.
Key findings
- Count and value point in opposite directions. Developer tools: 9% of deals, 49.6% of stated value. Applications: 35% of deals, 2.8% of value. Even without Cursor, developer tools are 17.4% of the remaining value.
- The stated money is concentrated in a handful of deals. The largest deal is 39.1% of stated value, the top three 60.5%, the top ten 85.6%. The 19 deals of $1B or more account for 95.2%.
- Licensing-and-hire is a big-tech structure. All seven such deals in the tracker were made by NVIDIA, Google, Meta or Apple. They are 3.7% of deals and 19.1% of stated value, and two thirds of big tech’s stated deal value.
- The labs buy small, often and quietly. OpenAI leads with 12 deals; frontier labs use acqui-hires for 29% of their deals, against 1% for buyers outside the labs and big tech. Incumbent software firms such as Salesforce and ServiceNow buy agents and data.
- Most of the dollar total is reported, not disclosed. 16 of 189 deals (8.5%) have a company-disclosed price. Press reports carry 78.6% of the stated value, including the largest deal.
How we built the numbers
The tracker records deals announced since 1 January 2025 in which a company acquires, acqui-hires, or licenses and hires an AI company or a defined AI team. It holds 190 rows as of 29 October 2026. One deal, Meta’s purchase of Manus, is marked terminated and is excluded everywhere, as the tracker’s own totals do, leaving 189 live deals from 129 different acquirers.
A “stated price” is the tracker’s term for a headline price that was either disclosed by the companies or reported by a credible outlet. Valuations, funding totals and analyst estimates are never recorded as prices. That gives 42 deals with a stated price and 147 without one. Thirteen of the unpriced deals carry a note in the data with an estimate or context (for example “estimated tens of millions”), and we do not count those notes as prices.
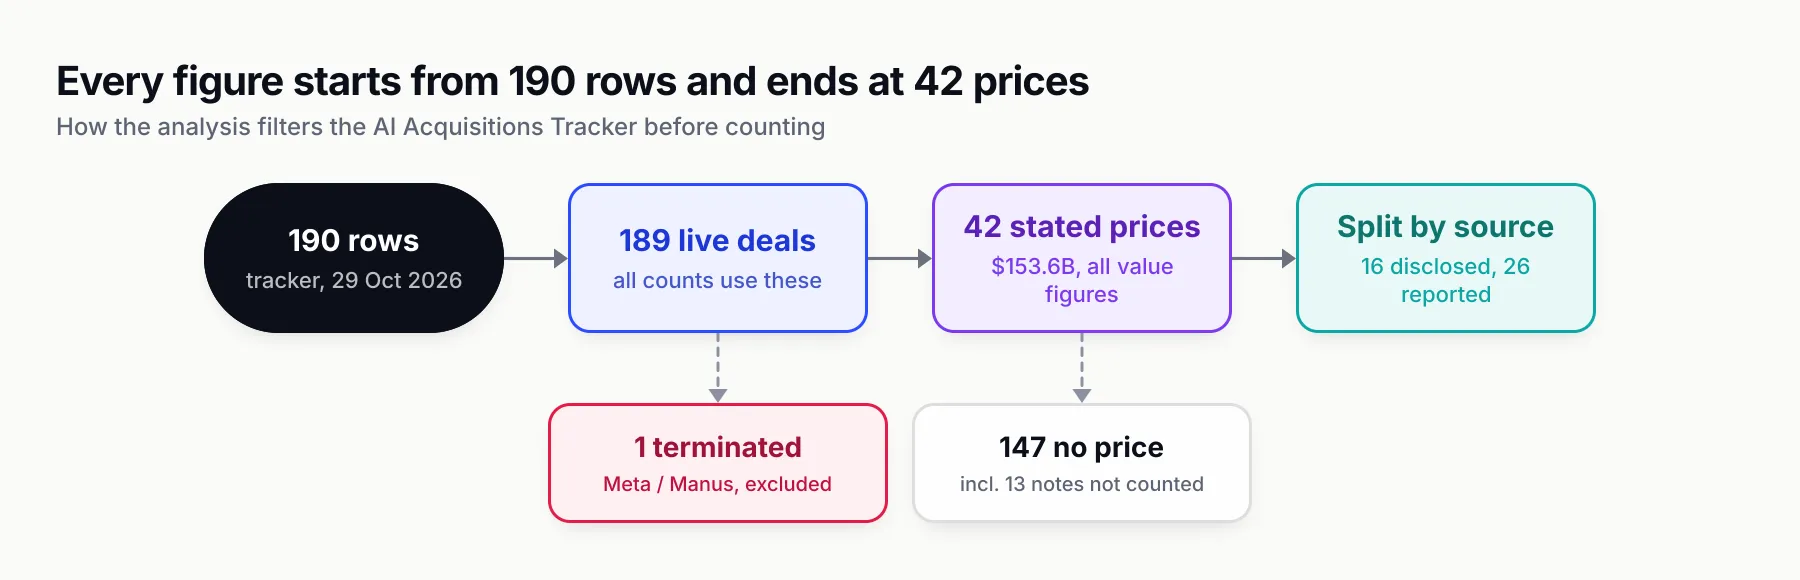
Figure 1: Counts use all 189 live deals; anything expressed in dollars uses only the 42 with a stated price.
That distinction matters for every finding below. When we say “share of deals” the base is 189. When we say “share of stated value” the base is $153.6B across 42 deals. The median stated price is $908M and the mean $3.66B, a gap that already tells you the distribution is lopsided.
Developer tools are 9% of deals and half the stated money
Sort the 189 deals by what the target does and applications dominate: 67 deals, more than a third of the tracker. These are AI products sold to an end user or a business function, from legal research to patient intake to presentation software. Agents follow with 33 deals, then models (19) and developer tools (17).
Sort by stated dollars and the picture flips.
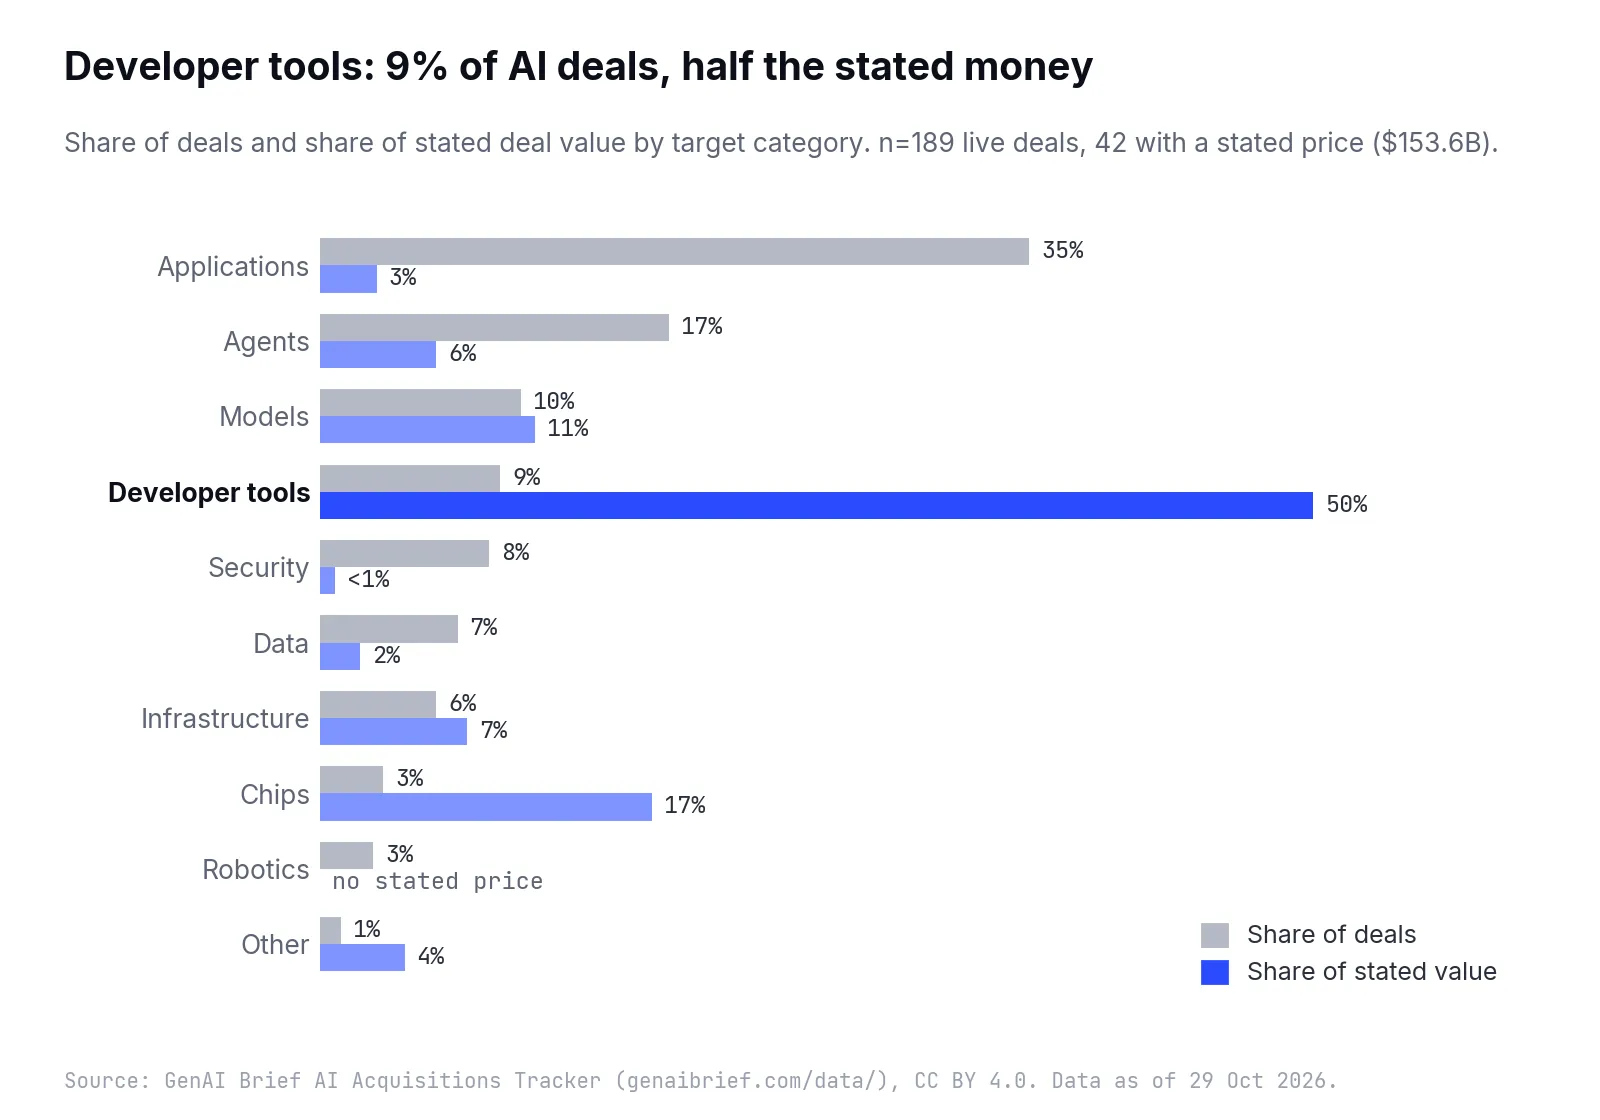
Figure 2: Developer tools and chips punch far above their deal count; applications, agents and security sit far below it.
| Category | Deals | Share of deals | Priced | Stated value | Share of value | Median stated price |
|---|---|---|---|---|---|---|
| Applications | 67 | 35% | 13 | $4.4B | 2.8% | $170M |
| Agents | 33 | 17% | 7 | $8.9B | 5.8% | $955M |
| Models | 19 | 10% | 5 | $16.5B | 10.7% | $1.6B |
| Developer tools | 17 | 9% | 5 | $76.3B | 49.6% | $2.4B |
| Security | 16 | 8% | 2 | $1.2B | 0.8% | $590M |
| Data | 13 | 7% | 1 | $3.1B | 2.0% | $3.1B |
| Infrastructure | 11 | 6% | 4 | $11.3B | 7.4% | $1.3B |
| Chips | 6 | 3% | 4 | $25.5B | 16.6% | $2.3B |
| Robotics | 5 | 3% | 0 | no stated price | n/a | n/a |
| Other | 2 | 1% | 1 | $6.5B | 4.2% | $6.5B |
Measured in stated dollars, developer tools outweigh applications 18 times over. Put the other way, there are 15.4 application deals for every $1B of stated application value.
How much of this is one deal?
A lot. The five priced developer-tools deals are SpaceX and Cursor ($60.0B), NVIDIA and Hugging Face ($12.9B), Google’s licensing-and-hire deal with Windsurf ($2.4B), Dynatrace and Arize AI ($915M) and Kapital and Woz ($30M). Cursor’s own announcement says simply that it “has officially been acquired by SpaceX” and gives no price; the $60.0B in the tracker is a reported figure attributed to CNBC, Reuters and Bloomberg.
Remove Cursor and developer tools still account for $16.3B, or 17.4% of the remaining $93.6B. That is still roughly double their 9% share of deal count, so the inversion survives the removal of its biggest single input, just in a much milder form. The robust claim is “developer tools are priced well above their share of deals”; the eye-catching “half of all money” depends on one transaction.
Why the tooling layer commands the prices
The two biggest developer-tools deals have one thing in common: the buyer owns compute or a model and wants the place where developers already work. NVIDIA’s announcement of the Hugging Face deal states the price precisely, “NVIDIA has agreed to acquire Hugging Face for $12,930,300,000”, and adds that NVIDIA compute will not be required to build on or deploy through the platform. Cursor’s post says that joining SpaceX gives it access to “the largest fleet of GPUs in the world”. In both cases a distribution point for developers is being joined to a supplier of compute or models.
We think that pattern explains more than any category label. Coding assistants and model hubs sit where usage decisions are made: which model gets called, how often, on whose hardware. Our comparison of Cursor and Claude Code covers why the editor and the agent loop have become the place where model choice is made. Applications, by contrast, are numerous, often small and bought for a team or a feature; the median priced application deal is $170M against $2.4B for developer tools.
Chips show the same shape at smaller scale: 6 deals (3%) but $25.5B (16.6%) of stated value, with four of the six carrying a price. Robotics is the opposite case: 5 deals and not a single stated price.
A handful of deals carry almost all the value
The developer-tools finding is a special case of a more general one: stated AI deal value is concentrated to a degree that makes averages almost meaningless.
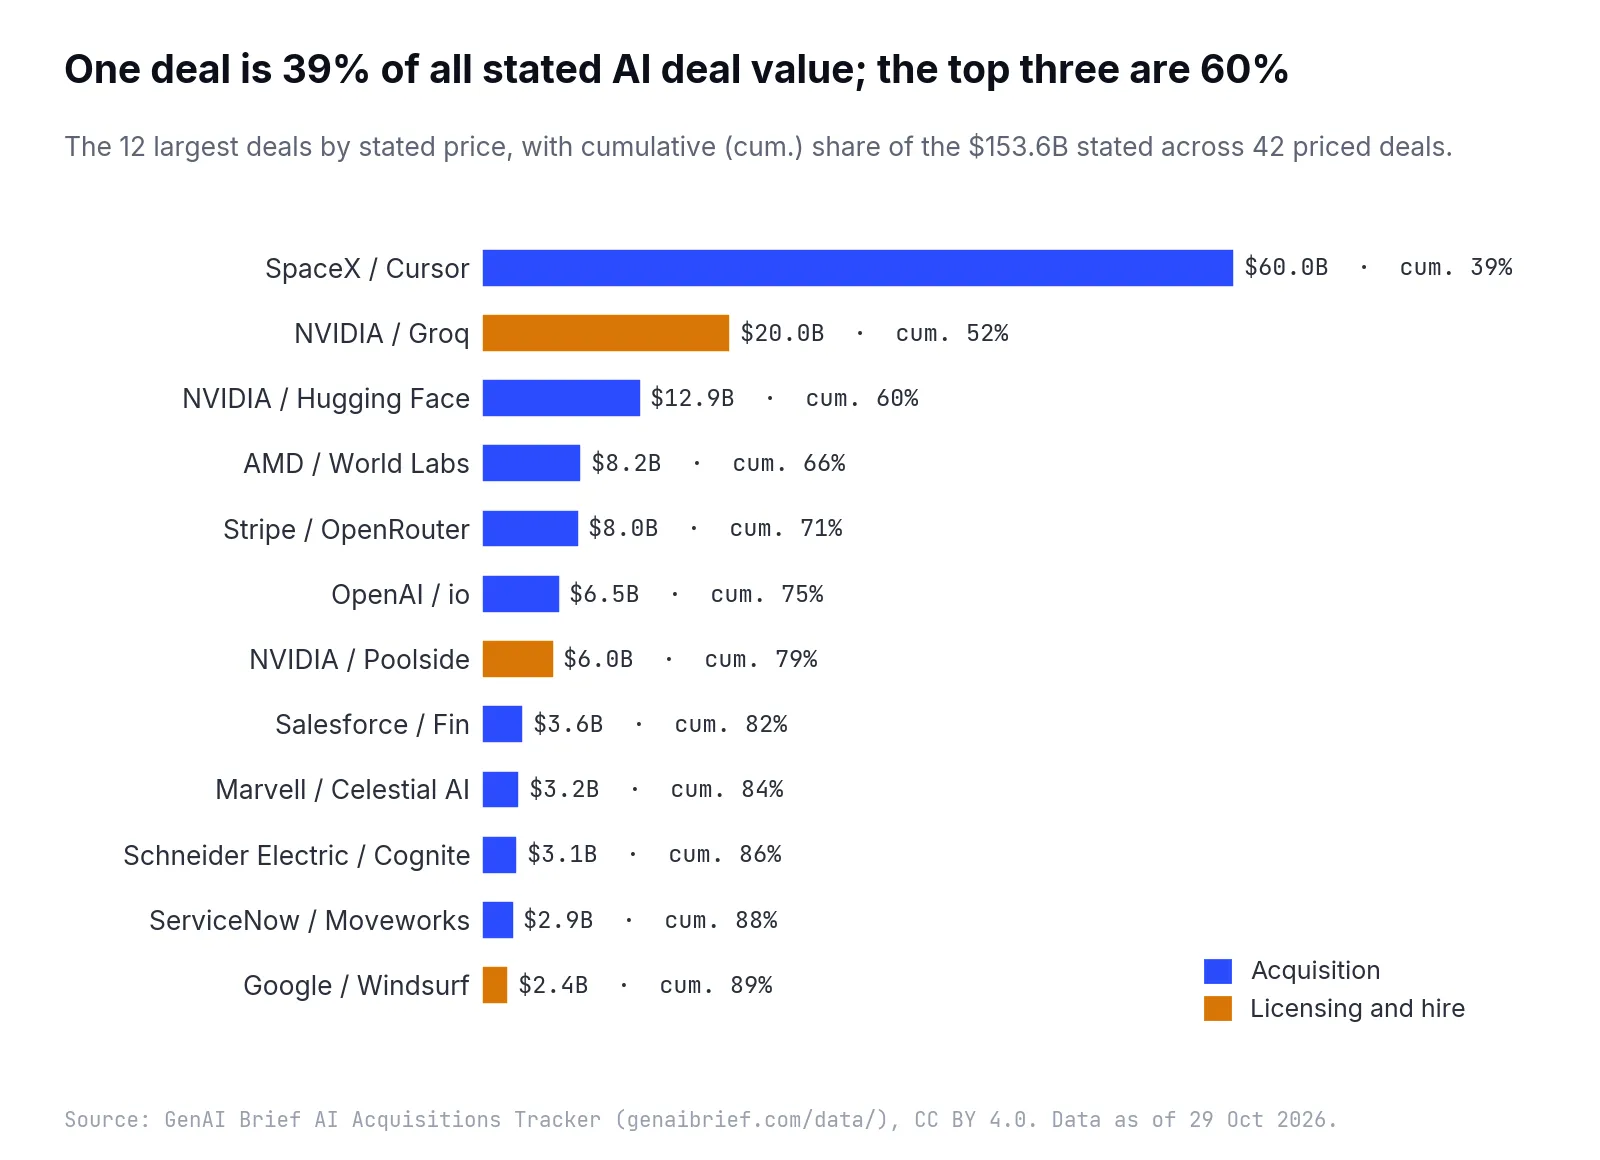
Figure 3: The first bar alone is 39% of stated value; by the twelfth, 89% is accounted for.
| Rank | Deal | Stated price | Structure | Price source | Cumulative share |
|---|---|---|---|---|---|
| 1 | SpaceX / Cursor | $60.0B | Acquisition | Reported | 39.1% |
| 2 | NVIDIA / Groq | $20.0B | Licensing and hire | Reported | 52.1% |
| 3 | NVIDIA / Hugging Face | $12.9B | Acquisition | Disclosed | 60.5% |
| 4 | AMD / World Labs | $8.2B | Acquisition | Disclosed | 65.8% |
| 5 | Stripe / OpenRouter | $8.0B | Acquisition | Reported | 71.0% |
| 6 | OpenAI / io | $6.5B | Acquisition | Reported | 75.3% |
| 7 | NVIDIA / Poolside | $6.0B | Licensing and hire | Reported | 79.2% |
| 8 | Salesforce / Fin | $3.6B | Acquisition | Disclosed | 81.5% |
| 9 | Marvell / Celestial AI | $3.2B | Acquisition | Reported | 83.6% |
| 10 | Schneider Electric / Cognite | $3.1B | Acquisition | Reported | 85.6% |
The split by size is stark. The 19 deals of $1B or more add up to $146.2B, 95.2% of stated value. The other 23 priced deals add up to $7.4B, or 4.8%, and eight of them are under $100M. The median stated price, $908M, falls almost exactly on the boundary between those groups, and removing Cursor barely moves it ($900M) even though it removes $60.0B from the total.
What concentration does to any “AI M&A total”
Any headline figure for AI deal value is mostly a statement about three or four transactions. If the Cursor price had been reported at half its level, total stated value would drop by roughly a fifth. If a single large deal is announced next month, the total for the period will jump in a way that says little about the market as a whole.
The practical consequence is that totals are fragile and medians are better behaved. For anyone using the tracker as a benchmark, the useful questions are local: what did comparable targets in the same category, bought by the same type of acquirer, fetch? The table above and the category medians earlier answer that better than any grand total.
Several of the top ten are worth reading in the primary source. AMD’s release on World Labs states that “the all-stock transaction is valued at approximately $8.2 billion”, subject to regulatory approval. Salesforce says it will acquire Fin for approximately $3.6 billion, subject to customary purchase-price adjustments. Stripe’s announcement that it has agreed to acquire OpenRouter gives no price at all; the tracker’s $8.0B comes from Reuters and Bloomberg. Teams that route traffic through hosted aggregators will find the context in our piece on OpenRouter alternatives.
Licensing-and-hire: seven deals, a fifth of the money, all big tech
The tracker classifies each deal by structure. Ordinary acquisitions dominate the count, 171 of 189. Ten are acqui-hires, in which the buyer takes the team and usually winds the product down. One is a merger (SpaceX and xAI, recorded without a price because the reported figure is a valuation). And seven are licensing-and-hire deals: the buyer licenses the startup’s technology and hires its founders and key staff, while the company itself carries on.
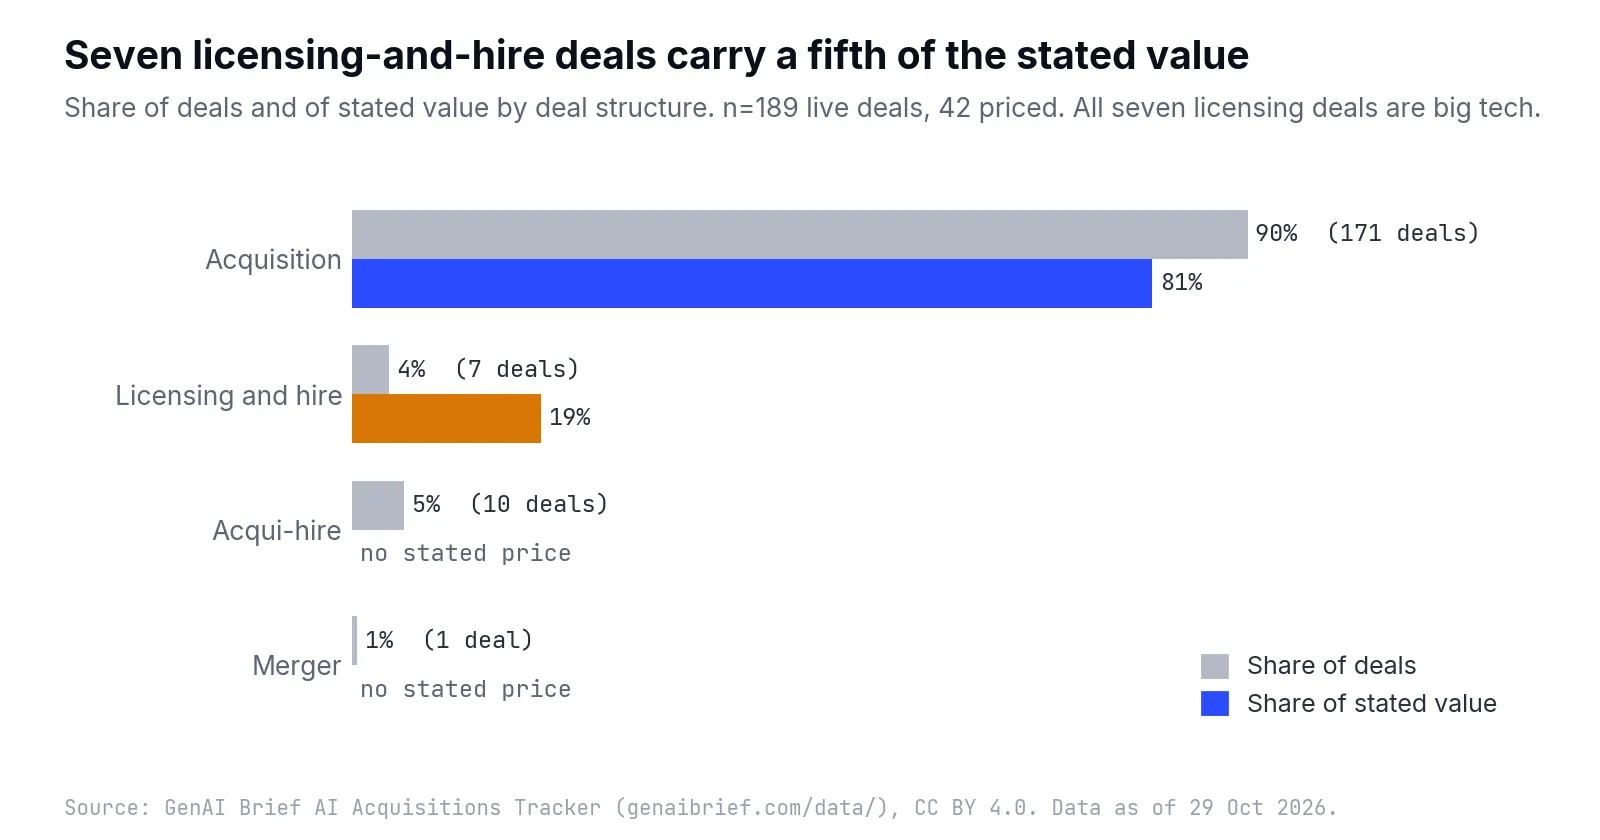
Figure 4: Licensing-and-hire deals are rare but large, and acqui-hires are common but never priced.
| Structure | Deals | Share of deals | Priced | Stated value | Share of value | Median stated price |
|---|---|---|---|---|---|---|
| Acquisition | 171 | 90.5% | 37 | $124.2B | 80.9% | $750M |
| Licensing and hire | 7 | 3.7% | 5 | $29.4B | 19.1% | $2.4B |
| Acqui-hire | 10 | 5.3% | 0 | no stated price | n/a | n/a |
| Merger | 1 | 0.5% | 0 | no stated price | n/a | n/a |
Who uses the structure
Every one of the seven licensing-and-hire deals was struck by a company in our big-tech group:
| Date | Buyer | Target | Category | Stated price |
|---|---|---|---|---|
| Jul 2025 | Windsurf | Developer tools | $2.4B | |
| Sep 2025 | NVIDIA | Enfabrica | Chips | $900M |
| Dec 2025 | NVIDIA | Groq | Chips | $20.0B |
| Mar 2026 | Meta | Dreamer | Agents | no stated price |
| May 2026 | Google DeepMind | Contextual AI | Models | $100M |
| Aug 2026 | NVIDIA | Poolside | Models | $6.0B |
| Oct 2026 | Apple | Huxe | Applications | no stated price |
NVIDIA alone accounts for three of them and $26.9B of stated value. Not one of the 169 deals made by frontier labs or other acquirers uses the structure. Within big tech it is now routine: 7 of big tech’s 20 deals are licensing-and-hire, and those deals carry $29.4B of big tech’s $43.9B in stated value (67%).
Groq’s own announcement shows what the structure looks like in practice. It describes a “non-exclusive licensing agreement” with NVIDIA, says its founder, its president and other members of the team will join NVIDIA, and states that “Groq will continue to operate as an independent company” under a new chief executive. No price appears in the announcement; the $20.0B in the tracker is CNBC’s reported figure, which the companies did not confirm.
Why the structure matters
The tracker does not record motives and we do not infer them. What the public record shows is that competition authorities have been examining arrangements that combine hiring with technology access. The UK Competition and Markets Authority opened a merger inquiry into Microsoft’s hiring of former Inflection staff and associated arrangements, and in September 2024 cleared it. The US Federal Trade Commission’s staff report on AI partnerships warned that such arrangements may impact access to certain inputs, naming computing resources and engineering talent.
What the data does show is that the structure is used for large, priced deals. Five of seven licensing-and-hire deals (71%) carry a stated price, against 22% of ordinary acquisitions, and the median priced licensing deal is $2.4B (n=5) against $750M for acquisitions (n=37). With five priced deals the median is fragile, but the direction is clear: this is where big tech puts its largest AI cheques.
Acqui-hires are the opposite
Acqui-hires are the mirror image: ten deals, none with a stated price, mostly small teams. Six of the ten were made by frontier labs (four by OpenAI, two by Anthropic), two by big tech (Meta and Microsoft) and two by others (Salesforce and Harvey). Where licensing-and-hire moves big money for technology plus people, the acqui-hire moves people and quietly closes the product.
OpenAI is the busiest buyer, and the labs buy differently
Count deals by acquirer and a frontier lab tops the list. OpenAI has 12 deals in the tracker, ahead of Salesforce (10) and Meta (9), with NVIDIA and Anthropic on 5 and ServiceNow and Databricks on 4. These seven buyers account for 49 deals, 26% of the total. The long tail is long: 105 acquirers appear exactly once, and their single deals make up 56% of the tracker.
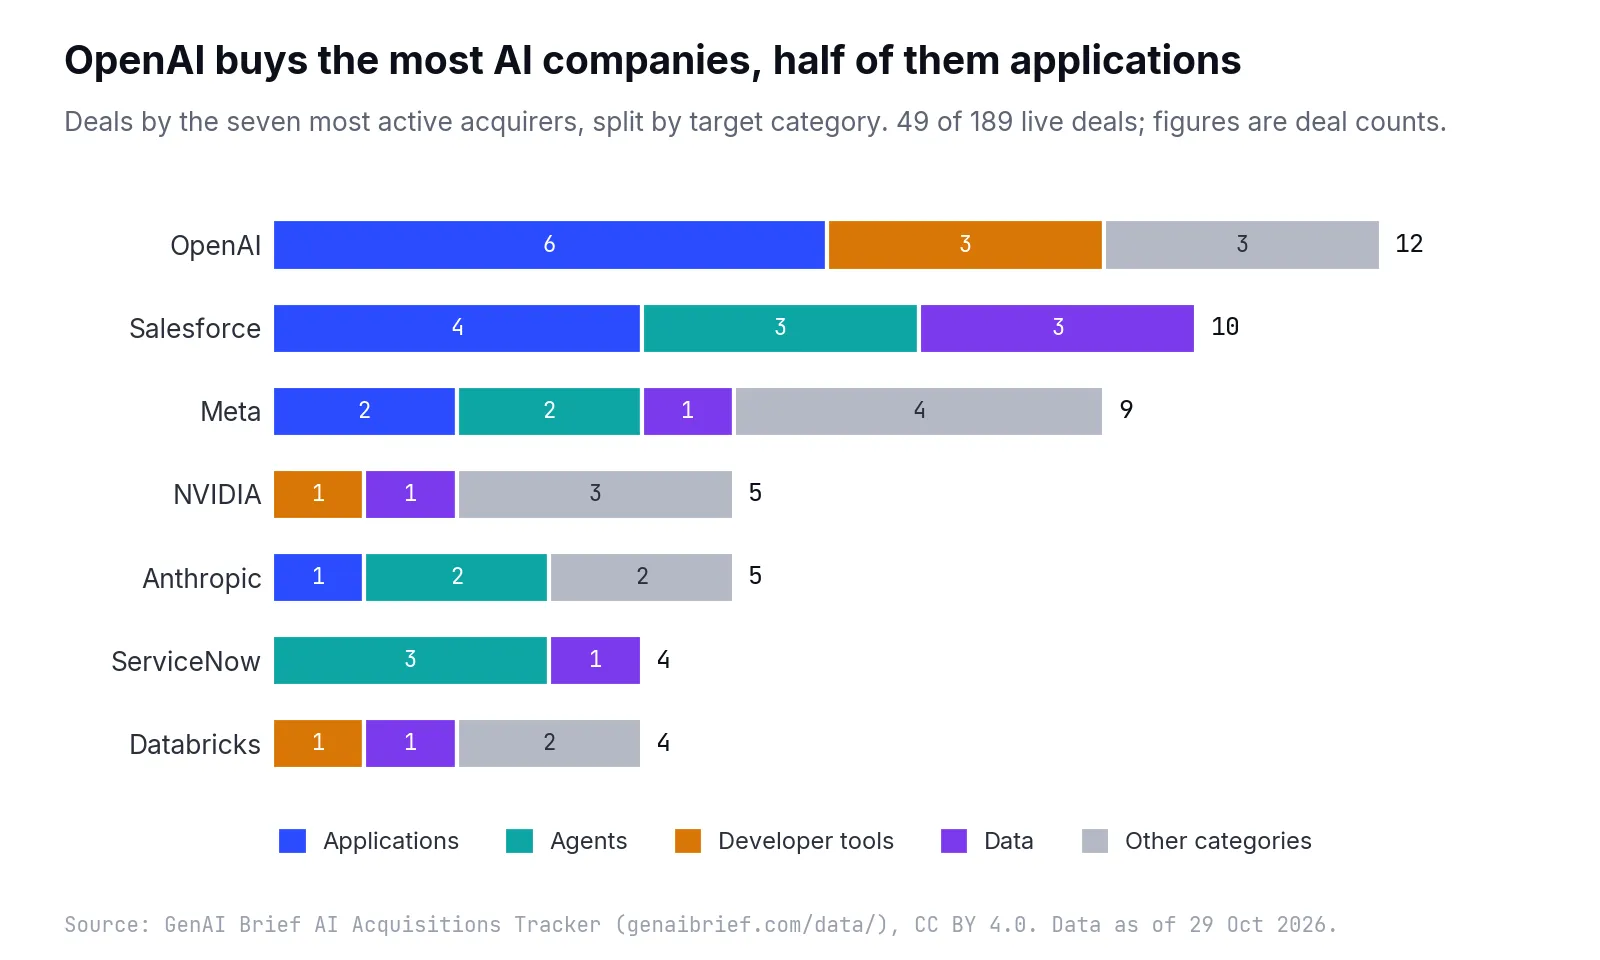
Figure 5: OpenAI buys applications and developer tools; Salesforce and ServiceNow buy agents and data.
| Acquirer | Deals | Applications | Agents | Developer tools | Data | Other categories | Acqui-hires | Priced |
|---|---|---|---|---|---|---|---|---|
| OpenAI | 12 | 6 | 0 | 3 | 0 | 3 | 4 | 2 |
| Salesforce | 10 | 4 | 3 | 0 | 3 | 0 | 1 | 1 |
| Meta | 9 | 2 | 2 | 0 | 1 | 4 | 1 | 0 |
| NVIDIA | 5 | 0 | 0 | 1 | 1 | 3 | 0 | 4 |
| Anthropic | 5 | 1 | 2 | 0 | 0 | 2 | 2 | 1 |
| ServiceNow | 4 | 0 | 3 | 0 | 1 | 0 | 0 | 1 |
| Databricks | 4 | 0 | 0 | 1 | 1 | 2 | 0 | 0 |
Three kinds of buyer
To compare what different buyers want, we grouped acquirers into three sets defined in the script: frontier labs (OpenAI, Anthropic, Mistral AI, Cohere), big tech (Meta, NVIDIA, Google including DeepMind, Apple, Microsoft) and everyone else. The grouping is ours and deliberately narrow.
| Group | Deals | Acquirers | Top categories | Acqui-hire or licensing share | Stated value |
|---|---|---|---|---|---|
| Frontier labs | 21 (11%) | 4 | Applications 38%, developer tools 14%, infrastructure 14% | 29% acqui-hires | $7.0B (5%) |
| Big tech | 20 (11%) | 6 | Models 25%, applications 20%, data 15% | 35% licensing and hire, 10% acqui-hires | $43.9B (29%) |
| Other acquirers | 148 (78%) | 119 | Applications 37%, agents 20%, security 9% | 1% acqui-hires | $102.7B (67%) |
Three patterns stand out, with the caveat that the lab and big-tech groups each hold about 20 deals, so single deals move the percentages by around five points.
The labs are building products and teams. Eight of the labs’ 21 deals are applications, and six are acqui-hires. OpenAI’s list runs from coding and evaluation teams (Context.ai, Alex, Neptune) to consumer and health applications (Roi, Torch, Orchestra Bio) and a security testing tool (Promptfoo). Anthropic’s five deals are all dated 2026 and lean towards agents and infrastructure; its announcement of the Vercept deal says the startup “will wind down its external product” and join work on Claude’s computer use. Buying a team and closing the product is the common thread.
Big tech buys models and silicon. Seven of big tech’s 20 deals are models or chips, and those are the deals where it pays most. Meta’s nine deals are the most spread out of any top acquirer, covering models, agents, data, applications and robotics.
Incumbent software companies buy agents and data for their platforms. Six of Salesforce’s ten deals are agents or data companies, including Fin, its largest at $3.6B. Three of ServiceNow’s four are agents. Databricks has bought two security companies and one each in data and developer tools. These look like platform extensions: a buyer with an installed base adding an AI capability it can sell to existing customers.
OpenAI’s count is not a trend
OpenAI’s deals are split evenly, six dated 2025 and six dated 2026. Because the tracker covers 2025 more thinly than 2026, that even split cannot be read as OpenAI slowing down or speeding up. All the data supports is that OpenAI is the most frequent buyer across the period as recorded.
Fewer than one deal in ten has a price the companies disclosed
The last finding concerns the foundation of every dollar figure above. Of 189 live deals, 42 have a stated price. Of those 42, only 16 prices were disclosed by the companies themselves; the other 26 come from press reports. That means 8.5% of all deals have a company-disclosed price.
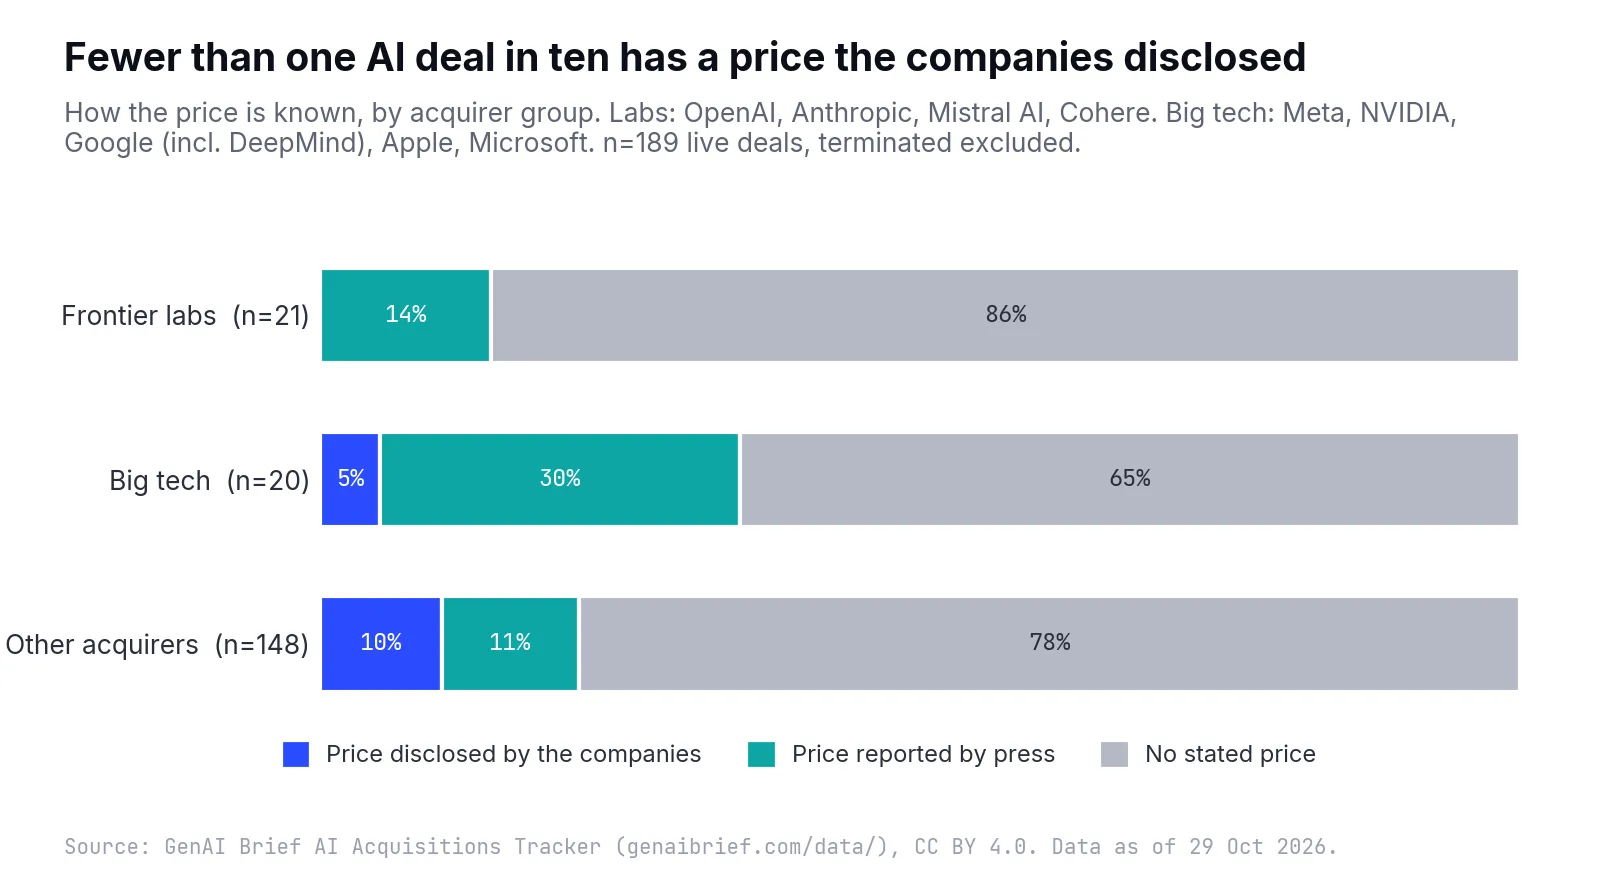
Figure 6: No frontier-lab deal has a company-disclosed price; big tech’s stated prices come almost entirely from the press.
| Group | Deals | Disclosed by companies | Reported by press | No stated price |
|---|---|---|---|---|
| Frontier labs | 21 | 0 (0%) | 3 (14%) | 18 (86%) |
| Big tech | 20 | 1 (5%) | 6 (30%) | 13 (65%) |
| Other acquirers | 148 | 15 (10%) | 17 (11%) | 116 (78%) |
| All | 189 | 16 (8.5%) | 26 (13.8%) | 147 (77.8%) |
The dollars rest on reporting
Measured by value the imbalance is larger. Disclosed prices total $32.9B (21.4% of stated value); reported prices total $120.8B (78.6%). Seven of the ten largest deals are reported rather than disclosed, including the largest of all. The median reported price is $978M (n=26) against $360M for disclosed prices (n=16), so the press reports the big ones and the companies disclose the smaller ones more often.
Big tech is the most likely group to have any stated price (35% of its deals), but only one of its 20 deals, NVIDIA’s Hugging Face purchase, has a price the companies stated. Frontier labs have the lowest rate of any price (14%), and their three priced deals, OpenAI and io ($6.5B), Anthropic and Coefficient Bio ($400M) and OpenAI and Torch ($60M), are all reported.
Disclosure varies by category too
| Category | Priced / deals | Price rate |
|---|---|---|
| Chips | 4 / 6 | 67% |
| Infrastructure | 4 / 11 | 36% |
| Developer tools | 5 / 17 | 29% |
| Models | 5 / 19 | 26% |
| Agents | 7 / 33 | 21% |
| Applications | 13 / 67 | 19% |
| Security | 2 / 16 | 12% |
| Data | 1 / 13 | 8% |
| Robotics | 0 / 5 | 0% |
Chip deals are usually priced, perhaps because the buyers are public semiconductor firms and the sums are large. Data and security deals almost never are. That interacts with the category finding: part of the reason developer tools and chips look so valuable is that their prices get stated, while the many application, security and data deals are mostly invisible in dollar terms. The inversion in Figure 2 is real for stated prices, and the true gap is probably smaller, though there is no way to measure by how much.
What the data cannot tell us
It is a curated sample, not a census. The tracker was built by searching news coverage and reviewing deals one by one. It will miss small deals that drew no coverage, deals announced only in local languages and deals that were never announced.
2025 is under-covered. The tracker holds 157 deals dated 2026 and 32 dated 2025, and its own methodology says coverage of 2025 is thinner. Do not read that ratio of 4.9 to 1 as a rise in AI deal-making. For the same reason we make no claims about change over time in this piece. The 2025 deals that are present skew large and priced (10 of 32, or 31%, have a stated price, against 20% in 2026), which is what you would expect if smaller 2025 deals were missed.
Value covers 22% of deals. Every dollar figure describes the 42 priced deals. The 147 others are counted but never valued, and their prices are not zero. We do not impute them.
Reported prices are not confirmed prices. 26 of 42 prices come from credible outlets rather than the companies. Where reports conflicted, the tracker records the most authoritative, but reported figures can be revised.
Status is not kept current for every deal. 164 deals are marked announced and 25 completed. Status moves only when a source says so, so many “announced” deals have probably closed. We did not use status in any finding other than to exclude the one terminated deal.
Categories and groups are judgements. Each deal has one category, assigned by the tracker. Our three acquirer groups are a fixed list in the script; different boundaries (adding Amazon, counting SpaceX after its merger with xAI as a lab, splitting out enterprise software) would move the group percentages.
Co-occurrence is not motive. That big tech uses licensing-and-hire tells you what structure was chosen, not why. We report what the companies and the press said and draw no conclusion about intent. The same caution applies across datasets: three active acquirers here, Salesforce, Meta and Microsoft, also appear in the GenAI Brief layoffs tracker, which records that both happened, not that one caused the other.
How to check our numbers
Every figure in this article is printed by one script, which also draws the charts:
python3 scripts/research/ai-acquisitions-2026-analysis.pyIt reads src/data/datasets/ai-acquisitions.json, the same rows published as the tracker CSV and JSON on the AI Acquisitions Tracker page. The filters are:
- Terminated deals excluded (
status != "terminated"): removes one row, leaving 189. - Stated price means
value_usdis not null: 42 rows. - Disclosed vs reported is the first word of
value_note: 16 disclosed, 26 reported. - Estimates in notes are ignored for unpriced deals (13 rows).
- Acquirer groups are the
FRONTIER_LABSandBIG_TECHsets at the top of the script; everyone else is “Other acquirers”. - Shares of deals use 189 as the base; shares of value use $153.6B.
To check a single figure by hand, open the CSV, drop the terminated row, filter category to developer-tools, and add value_usd: you should get 17 rows and $76.3B. The data is free to reuse under CC BY 4.0 with a citation to the GenAI Brief AI Acquisitions Tracker.
What it means if you build, buy or sell in AI
If you run an AI developer-tools company, the data says buyers with compute or models will pay for the place where developers choose a model. It does not say every tooling company is worth billions: the five priced deals range from $30M to $60.0B. Your comparables are the category median ($2.4B, n=5) with Cursor taken out of your thinking.
If you run an application company, the data is less flattering. Applications are the largest category by count and the smallest by priced value, with a $170M median across 13 priced deals. Many of these deals are acquisitions of a team and a feature, and some are acqui-hires where the product closes. Plan as if the likely buyer is an incumbent software platform or a lab, and as if the price will not be made public. Our breakdown of the real cost of an AI product is a useful companion when thinking about what a buyer is actually acquiring.
If you negotiate with big tech, expect the licensing-and-hire structure. All seven in the tracker came from big tech, five of them priced, with a $2.4B median. The startup survives as a company, its key people do not, and regulators in the US and the UK have looked closely at arrangements of this kind.
If you are a corporate development or strategy team, benchmark on medians within a category and acquirer type, not on totals. One deal is 39.1% of stated value; any total will be dominated by whatever the largest transaction in your window happens to be.
If you cite AI M&A totals, say what is behind them. A sentence like “$153.6B in stated AI deal value since January 2025” is accurate for this tracker only with three qualifiers: 42 of 189 deals, 78.6% of the value reported rather than disclosed, and one deal at 39.1%.
The most useful thing the tracker shows is not how much money is moving but where it lands. It lands on the infrastructure developers touch, on silicon and on the teams the labs want to hire, and most of it is known only because reporters found out.
Sources
- AI Acquisitions Tracker (dataset, CSV and JSON) GenAI Brief
- Cursor is now a part of SpaceX Cursor
- NVIDIA to Acquire Hugging Face NVIDIA
- Groq and Nvidia enter non-exclusive inference technology licensing agreement Groq
- AMD to acquire World Labs to advance the future of AI compute AMD
- Stripe agrees to acquire OpenRouter Stripe
- Salesforce signs definitive agreement to acquire Fin Salesforce
- Anthropic acquires Vercept Anthropic
- FTC issues staff report on AI partnerships and investments study US Federal Trade Commission
- Microsoft / Inflection AI merger inquiry UK Competition and Markets Authority
Frequently asked questions
What are the biggest AI acquisitions of 2025 and 2026?
By stated price in the GenAI Brief tracker, the largest are SpaceX and Cursor ($60.0B, reported), NVIDIA's licensing-and-hire deal with Groq ($20.0B, reported), NVIDIA and Hugging Face ($12.9B, disclosed), AMD and World Labs ($8.2B, disclosed) and Stripe and OpenRouter ($8.0B, reported). Together the top five are 71.0% of all stated value.
How much money has been spent on AI acquisitions?
The 42 deals with a stated price add up to $153.6B, out of 189 live deals tracked since 1 January 2025. The other 147 deals have no stated price, so the true total is higher and unknown. We do not estimate missing prices.
Which company buys the most AI startups?
OpenAI, with 12 deals in the tracker, ahead of Salesforce (10), Meta (9), NVIDIA (5) and Anthropic (5). Half of OpenAI's deals (6 of 12) are applications, and 4 are acqui-hires.
What is a licensing-and-hire deal in AI?
The buyer licenses a startup's technology and hires its founders and staff without buying the company, which keeps operating. In the tracker all seven such deals were made by big tech, and the five with a price total $29.4B, 19.1% of all stated deal value.
Why do most AI acquisitions not disclose a price?
Private deals rarely require a public price. Only 42 of 189 tracked deals (22%) have any stated price, and only 16 (8.5%) a price disclosed by the companies themselves; the rest of the stated value comes from press reports.
Are AI acquisitions increasing in 2026?
The tracker holds 157 deals dated 2026 and 32 dated 2025, but its methodology says 2025 is covered more thinly, so the gap cannot be read as growth. It supports comparisons within the sample, not a year-on-year trend.