ResearchAnalysis
AI-native companies post 24% more for AI engineers, and two labs carry most of it
We analysed 832 US AI job postings with published pay ranges. AI-native firms post a $295.5K median midpoint against $238K elsewhere; without Anthropic and OpenAI the gap is 9%.
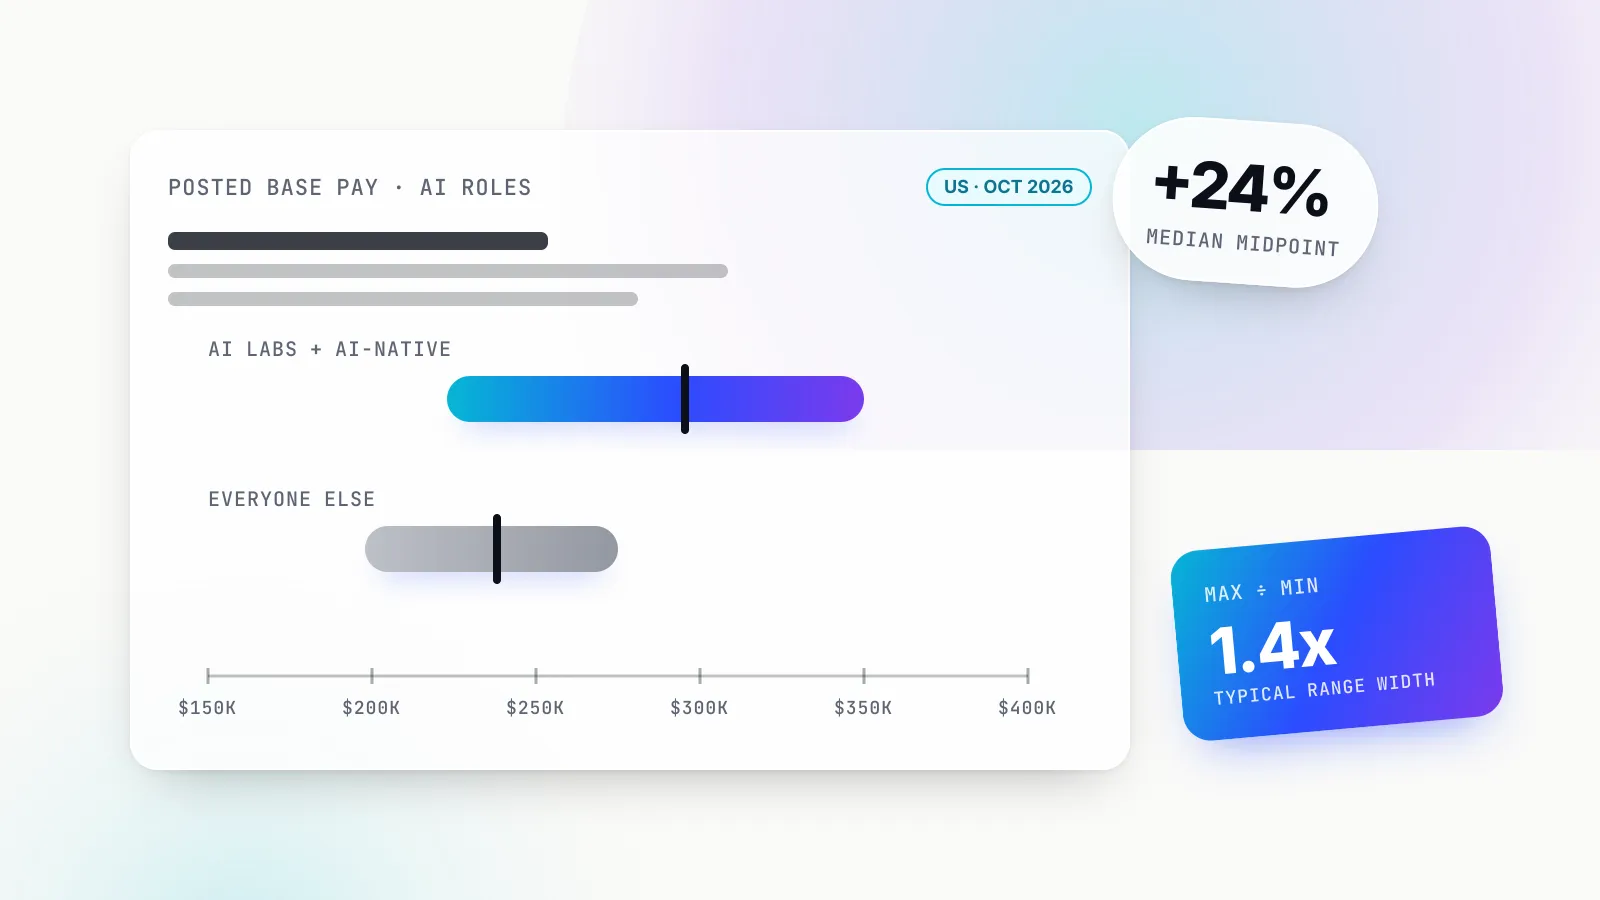
AI labs and AI-native startups advertise more for AI engineering work than the rest of the technology industry, and most of the difference comes from two employers. Across 832 US job postings with a published base-pay range, AI-native companies post a median range midpoint of $295.5K (n=389) against $238K (n=443) for everyone else, a gap of 24%.
Take Anthropic and OpenAI out and the gap shrinks to 9%. Hold the role mix, title level and California location constant and it settles at 13%. That is still a premium, and it holds inside every role family we could test, but it is a much smaller number than the headline. For anyone pricing an offer, setting a hiring budget or deciding where to apply, that difference matters.
This is original research built on the GenAI Brief AI Engineer Salaries dataset, a snapshot of live postings taken on 29 October 2026 from the public job boards of 74 AI labs, AI-native startups and technology companies. Every number below is printed by one analysis script that anyone can re-run, and every chart is drawn by it. The data is free to download as CSV.
Key findings
- AI-native firms post 24% more at the median: $295.5K (n=389) against $238K (n=443). Anthropic ($402.5K, n=78) and OpenAI ($318.5K, n=91) carry most of it; without them the gap is 9%, and 13% once role family, level and California are held constant.
- The premium is in the top of the range, not the bottom. The median posted minimum at AI-native firms is 12.5% higher than elsewhere; the median posted maximum is 27.3% higher.
- There is no remote discount in posted pay: $260.1K for remote-flagged postings against $260.0K for the rest. But the remote flag is noisy, and the picture changes by role family.
- AI startups post the widest ranges. The typical posting’s maximum is 1.4 times its minimum; five of the eight widest-ranging companies are AI-native, led by Mercor (2.27x) and Sierra (2.17x).
- Titles distort level comparisons. “Mid” postings out-earn “senior” ones ($245K vs $230K) only because 112 untitled Anthropic and OpenAI roles land in “mid”. Without them, levels rise in order.
- State medians track employers, not places. Washington’s $167.5K median (n=27) is mostly Palantir; without Palantir it is $207.5K (n=14).
What the data is, and how we classified companies
Each row in the dataset is one live job posting for a technical AI or ML role (engineer, scientist, researcher, developer, architect or member of technical staff) whose title names AI, ML, LLMs, inference, agents or a related field, and which publishes a base-pay range in US dollars. The dataset page describes the method in full: postings are read from each employer’s public Greenhouse, Ashby or Lever board, exact duplicates are counted once, and a posting with several location ranges contributes its first. Salary in this piece always means the midpoint of the posted base-pay range. Medians are taken across postings, so a company with many open roles weighs more than a company with one.
Those rules shape what the numbers can say. The 832 postings come from 74 companies, but 24 of those companies have fewer than five postings, and Anthropic and OpenAI together account for 169 postings, 20% of the total. 579 postings (70%) are in California. The overall median midpoint is $260K, the middle half runs from $217.2K to $307.5K, and the 90th percentile is $366.5K.
The central comparison needs a definition of “AI-native”, and any such list involves judgement. Ours is written into the analysis script as a named set so a reader can change it and re-run. A company is AI-native if its core product is an AI model, an AI application, AI developer tooling or inference software, or training data for AI models. Thirty companies in the snapshot qualify:
| Group | Companies in the snapshot |
|---|---|
| Model labs | Anthropic, OpenAI, xAI, Cohere, Inflection AI, Perplexity, Character.AI, Midjourney, Pika, Suno |
| AI applications and agents | Decagon, Sierra, Harvey, Glean, Writer, Abridge, Cognition, Lovable |
| AI tooling and inference | Together AI, Baseten, Modal, Anyscale, LangChain, Arize AI, Pinecone |
| AI training data | Scale AI, Mercor, Turing, Snorkel AI, Labelbox |
Nine companies are borderline: AI is central to what they sell, but the business is GPUs, chips, data centres, vehicles or robots. CoreWeave, Crusoe, Lambda and SambaNova sell compute; Waymo, Zoox, Nuro, Shield AI and Figure AI build autonomous machines. We count them with “everyone else” in the headline and test the result with them moved across. The remaining 35 companies, from Databricks and Snowflake to Airbnb, Reddit and Palantir, are other technology companies. Handshake, whose AI training-data business sits inside a careers platform, and Replit, a coding platform that predates its AI agent, are counted as other tech.
The analysis started from a narrower list of 23 AI-native names that left out several small model and tooling companies and included Figure AI. On that list the gap was 26% ($300K, n=378, against $238K, n=454). Folding the borderline compute and autonomy firms into AI-native lowers it to 19% ($280.5K, n=522, against $235.2K, n=310). The direction does not depend on where the line is drawn; the size moves by a few points.
Finding 1: the AI-native premium is real, and concentrated
The headline comparison is plain. The median AI-native posting has a midpoint of $295.5K. The median posting from everyone else has a midpoint of $238K. The borderline compute and autonomy group sits at exactly $238K as well (n=133), and the other tech companies at $235.2K (n=310), so the gap is between AI-native firms and the rest, not between the rest’s two halves.
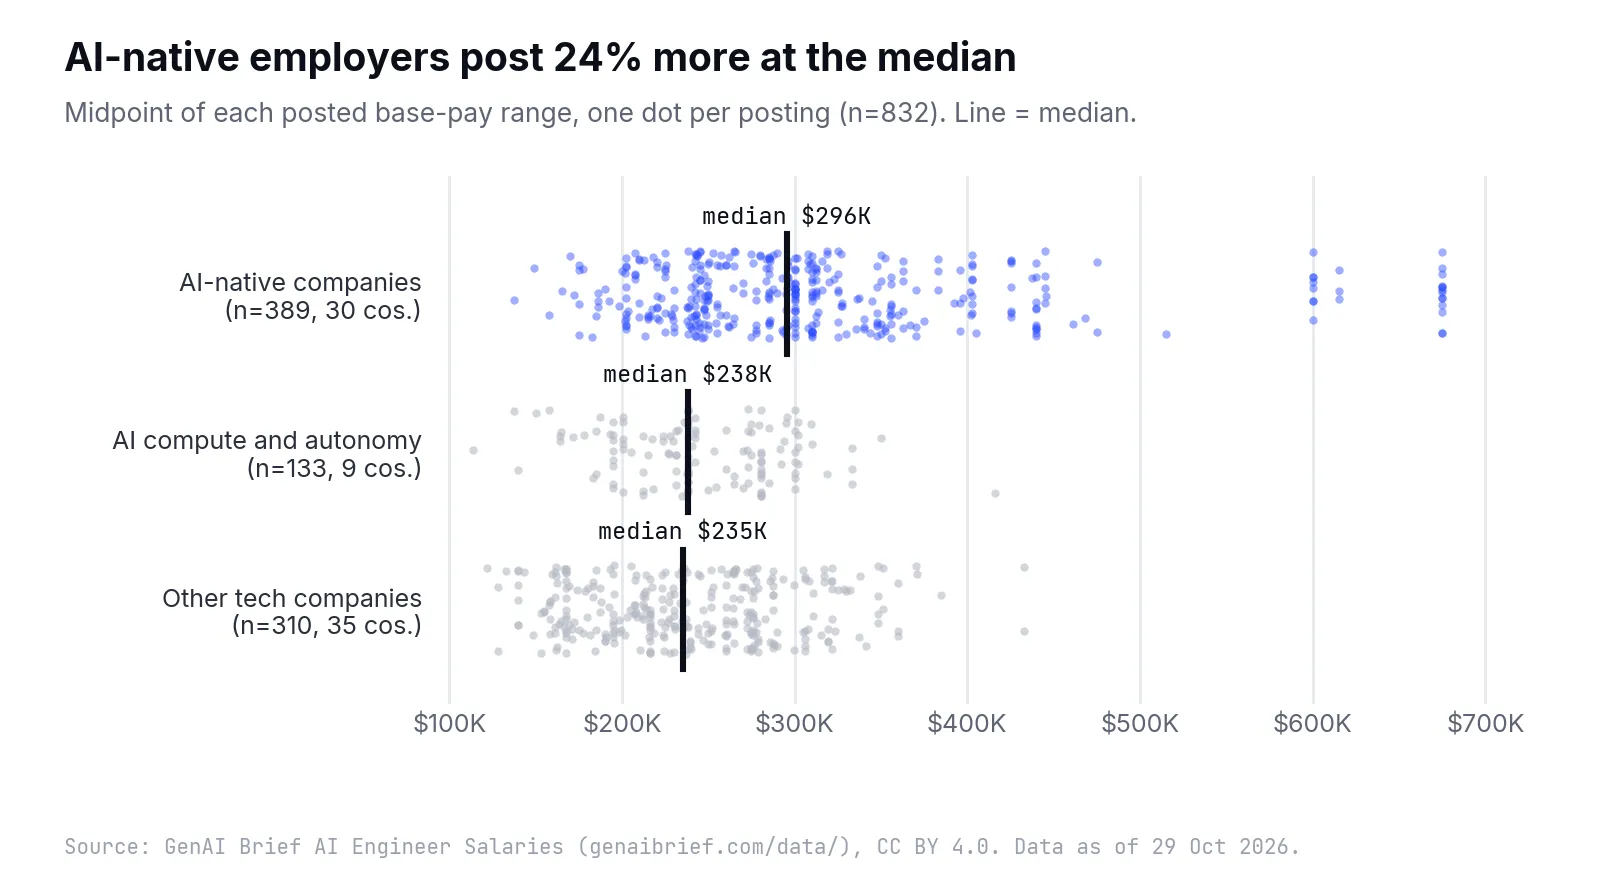
Chart 1: AI-native postings sit higher across the whole distribution, and almost every posting above $400K comes from one group.
The distribution says more than the medians. The middle half of AI-native postings runs from $243K to $350K; the middle half of everyone else’s runs from $198.9K to $277.5K. The tails are where the groups separate most: 16.7% of AI-native postings have a midpoint of $400K or more, against 0.7% of everyone else’s. Of the 68 postings in the snapshot at or above $400K, Anthropic posted 43 and OpenAI 20.
| Group | Companies | Postings | Median midpoint | Middle 50% |
|---|---|---|---|---|
| AI-native | 30 | 389 | $295.5K | $243K to $350K |
| Everyone else | 44 | 443 | $238K | $198.9K to $277.5K |
| of which AI compute and autonomy | 9 | 133 | $238K | |
| of which other tech | 35 | 310 | $235.2K |
That concentration is the first thing to test. Anthropic’s 78 postings have a median midpoint of $402.5K and OpenAI’s 91 a median of $318.5K. Together they are 169 of the 389 AI-native postings. Remove them and the remaining 220 AI-native postings have a median of $260K, 9.2% above everyone else. The premium survives, but most of the headline belongs to two companies.
The second test is role mix. AI-native firms hire more research scientists (76 of their postings, against 27 elsewhere) and research scientists are the best-paid family in the data. A premium that came only from hiring more researchers would not be a company-type effect at all. So we compared within each role family that has at least five postings on both sides.
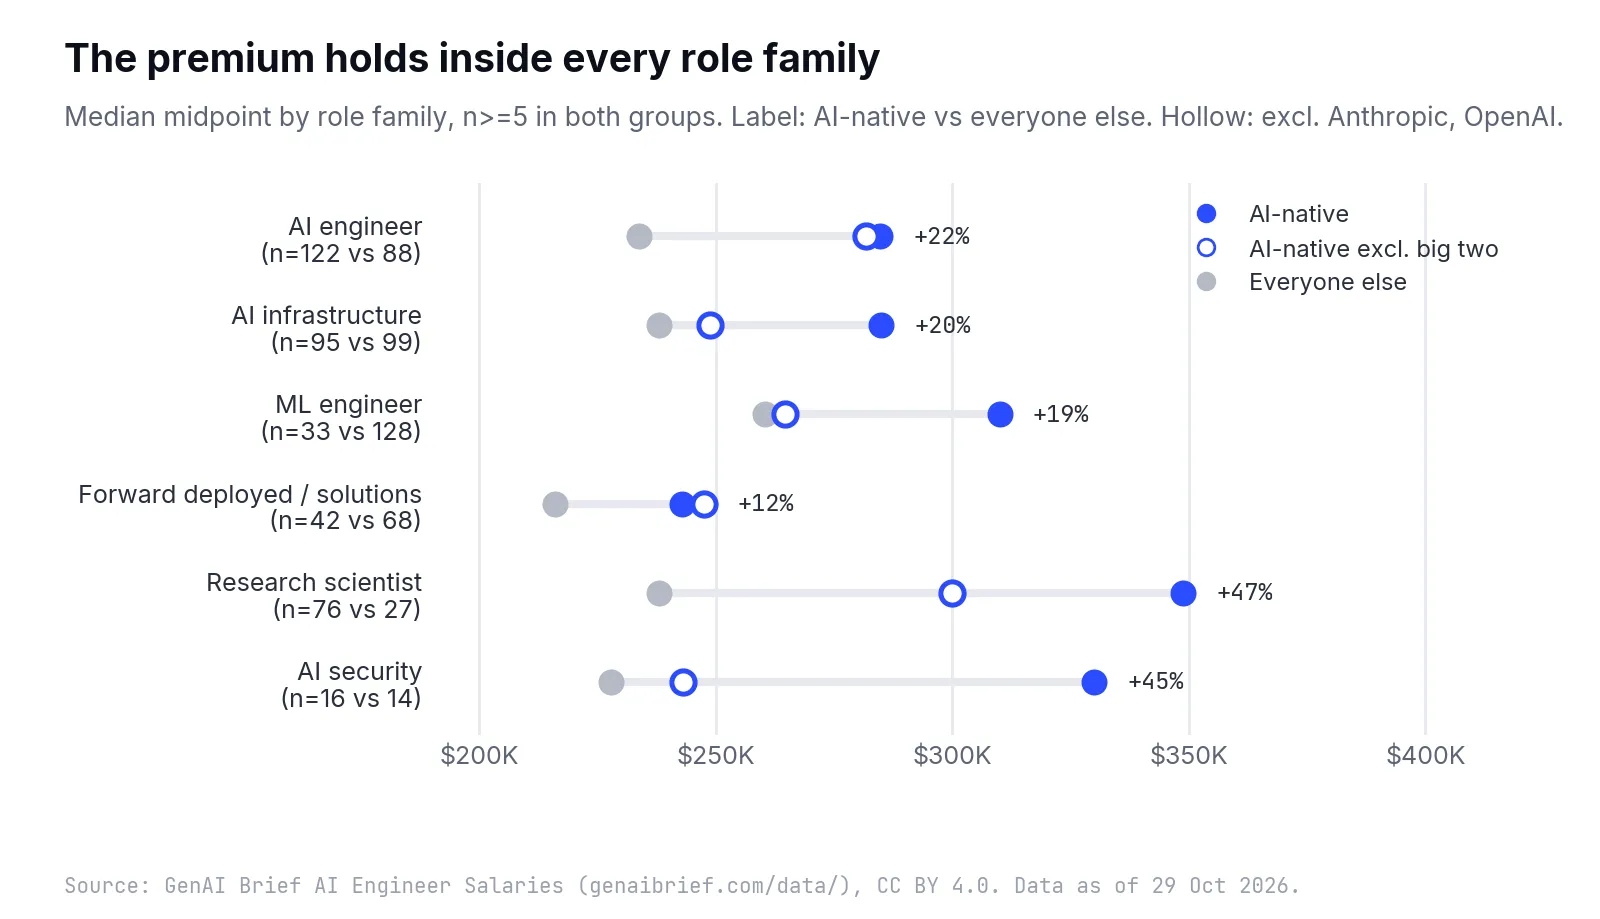
Chart 2: The premium appears inside every testable role family. Without the two biggest labs it shrinks to almost nothing in AI infrastructure and ML engineering, but stays large for AI engineers and research scientists.
| Role family | AI-native | Everyone else | Gap | AI-native excl. Anthropic and OpenAI | Gap |
|---|---|---|---|---|---|
| AI engineer | $284.8K (n=122) | $233.8K (n=88) | +21.8% | $281.8K (n=60) | +20.5% |
| AI infrastructure | $285.0K (n=95) | $238.0K (n=99) | +19.7% | $248.8K (n=68) | +4.5% |
| ML engineer | $310.0K (n=33) | $260.5K (n=128) | +19.0% | $264.6K (n=21) | +1.6% |
| Forward deployed / solutions | $242.8K (n=42) | $216.1K (n=68) | +12.3% | $247.5K (n=27) | +14.5% |
| Research scientist | $348.8K (n=76) | $238.0K (n=27) | +46.5% | $300.0K (n=35) | +26.1% |
| AI security | $330.0K (n=16) | $227.8K (n=14) | +44.9% | $243.0K (n=7) | +6.7% |
AI-native firms post more in all six families, and still do in all six once Anthropic and OpenAI are removed. Two summary numbers pull this together. A posting-weighted average of the within-family gaps is 23.5% with every company included and 11.2% without the two labs. A regression of log midpoint on an AI-native indicator, controlling for role family, title level and a California location, puts the premium at 25.5%, or 13.0% without the two labs. We read the defensible range for “the AI-native premium in posted base pay, outside the two biggest labs” as roughly 9% to 13%.
The family detail is where the reading gets interesting. For AI engineers, the premium barely moves when the big labs leave: $281.8K at the other AI-native firms against $233.8K elsewhere. Sierra, with 13 AI engineer postings, is the largest contributor to that group, and its ranges reach $390K or more. For AI infrastructure and ML engineering, by contrast, the premium is almost entirely Anthropic and OpenAI: the rest of the AI-native group posts within a few percent of Waymo, Pinterest, Zoox and Reddit, which dominate ML engineering hiring outside the labs.
Research scientists show the largest gap, and the most caution is needed there. Only 27 research scientist postings come from outside AI-native firms, and the 35 AI-native research postings outside the two labs include nine from Turing and seven from Scale AI, whose research roles centre on training data and evaluation. The 26.1% gap is real in this snapshot, but it rests on a small and particular comparison group. The AI security row is weaker still once the labs are removed: seven postings.
Where in the range the premium sits
A posted range has two ends, and they tell different stories. The median posted minimum at AI-native firms is $223K, against $198.2K elsewhere: 12.5% higher. The median posted maximum is $350K against $275K: 27.3% higher. AI-native employers set their floors only modestly above the market, then leave much more room above.
| AI-native | Everyone else | Gap | |
|---|---|---|---|
| Median posted minimum | $223K | $198.2K | +12.5% |
| Median posted maximum | $350K | $275K | +27.3% |
| Median range width in dollars | $115K | $70K |
That has a practical consequence. A candidate who lands near the bottom of an AI-native range is paid only a little more than at a large technology company, while a candidate who lands near the top is paid a great deal more. Which end an offer lands on depends on level, negotiation and the employer’s view of the candidate, none of which a posting reveals. The midpoint premium is an average over that uncertainty.
Finding 2: no remote discount, and a remote flag that means less than it says
The aggregate result is striking. Postings flagged as remote have a median midpoint of $260.1K (n=226). Postings not flagged remote have a median of $260.0K (n=606). Remote-flagged roles are 27.2% of the sample. There is no sign of the remote discount many candidates expect.
The flag deserves scrutiny before that result is trusted. It comes from each job board’s own field, and boards do not define it the same way. Ashby’s public job posting API documentation says its remote field is true when the workplace type is “Remote” or “Hybrid”. OpenAI posts through Ashby, and 53 of its 91 postings are flagged remote while naming a city: San Francisco (37), Washington, DC (7), New York City (6) and Seattle (3). Those are hybrid roles, not remote ones.
So we built a stricter measure: a posting counts as explicitly remote only if its location text says “remote” or names no state. 86 postings qualify, with a median of $264.7K, 1.8% above the not-remote median. The remaining 140 remote-flagged postings, which name a city, sit at $257K. Removing OpenAI altogether gives $257.5K for remote-flagged postings (n=173) against $251.9K for the rest (n=568). Every version of the comparison lands within a few percent of zero.
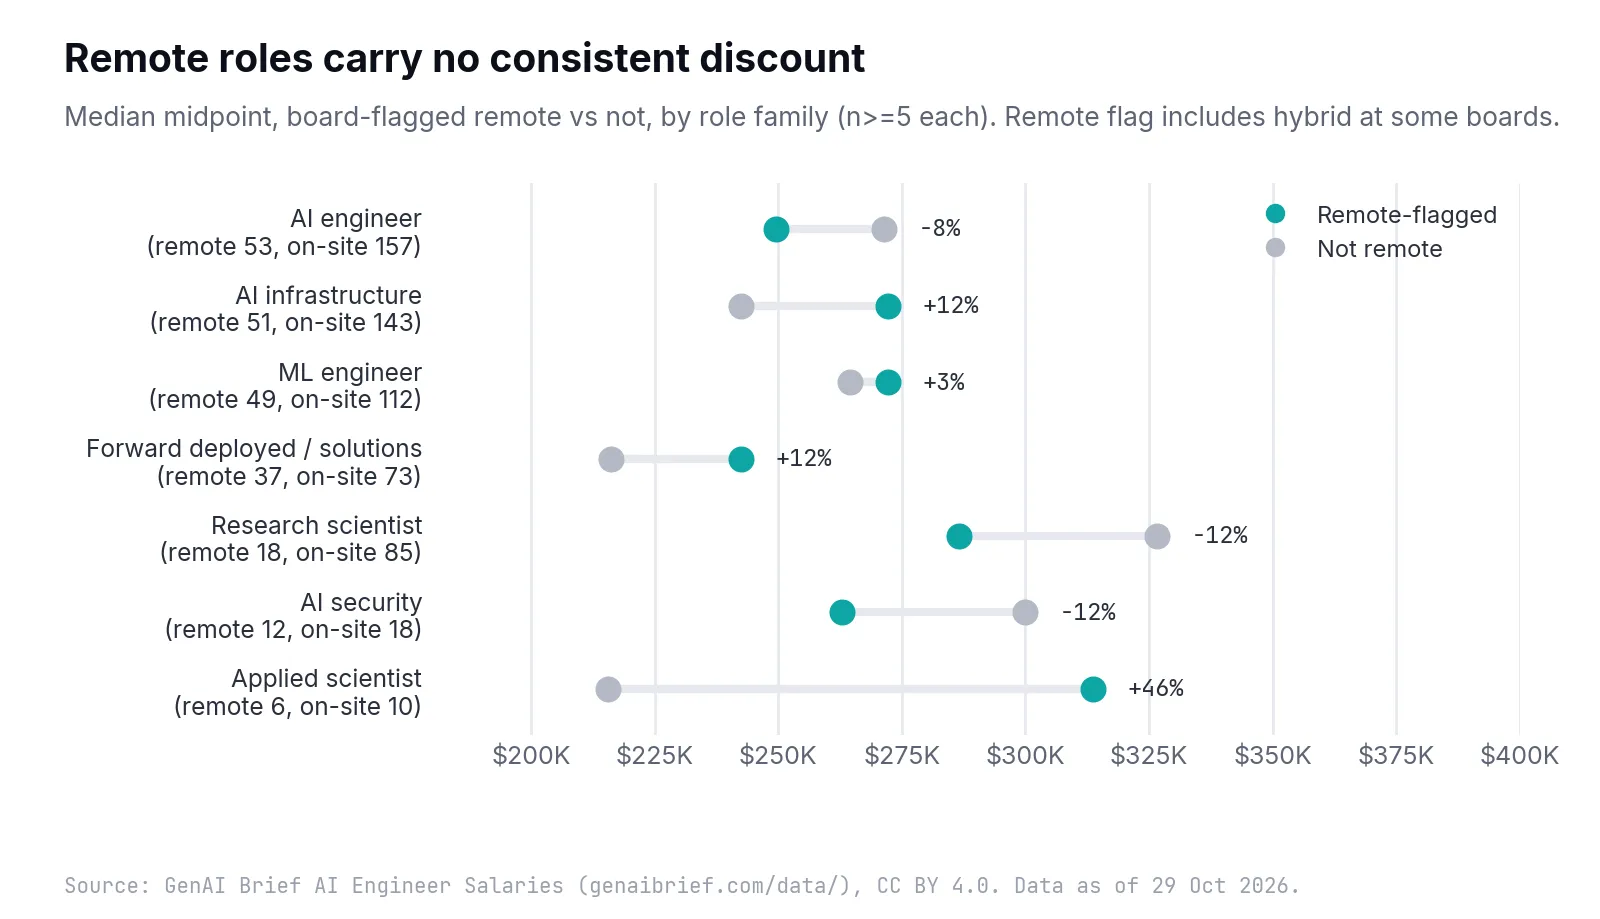
Chart 3: Within role families, remote-flagged postings are sometimes higher and sometimes lower. The aggregate tie is real, but it is not a law.
| Role family | Remote-flagged | Not remote | Difference |
|---|---|---|---|
| AI engineer | $249.5K (n=53) | $271.4K (n=157) | -8.1% |
| AI infrastructure | $272.2K (n=51) | $242.5K (n=143) | +12.2% |
| ML engineer | $272.2K (n=49) | $264.6K (n=112) | +2.9% |
| Forward deployed / solutions | $242.5K (n=37) | $216.1K (n=73) | +12.2% |
| Research scientist | $286.5K (n=18) | $326.7K (n=85) | -12.3% |
| AI security | $263.0K (n=12) | $300.0K (n=18) | -12.3% |
| Applied scientist | $313.7K (n=6) | $215.5K (n=10) | +45.6% |
By title level the picture is flatter: remote-flagged postings are 2.4% higher at mid level, 5.0% higher at senior, 1.6% lower at staff and above and 2.3% lower for managers. The role-family swings are mostly composition. The research scientist and AI security gaps come from the labs: the highest-paid research roles at Anthropic and OpenAI are on-site or hybrid in San Francisco. The AI infrastructure and forward-deployed gaps come from who posts remotely: Baseten flags all 17 of its postings remote, and Snowflake flags 14 of 27.
Remote mix differs by company type more than pay does. AI-native firms flag 29.3% of postings as remote, close to the 25.3% elsewhere, but on the strict measure only 4.6% of AI-native postings are explicitly remote, against 15.3% of everyone else’s. Of the 86 explicitly remote postings, 18 come from AI-native firms. The explicitly remote group is dominated by large, established remote-friendly employers: Reddit (21), Pinterest (12), Samsara (8), Airbnb (6) and Coinbase (6).
Within the five companies that post at least five roles each way, remote-flagged roles pay more at four: Snowflake (+19.2%), Airbnb (+11.0%), Pinterest (+5.1%) and Anthropic, whose five remote-flagged postings have a $600K median and are not a sample to generalise from. OpenAI is the exception, at -20%, and its “remote” postings are hybrid roles with a different mix: 12 of its 13 forward-deployed roles are flagged remote, while 13 of its 15 research scientist roles are not. The safest reading: in posted base pay for AI roles at these companies, working remotely is not priced at a discount, and companies that hire remotely appear to post national ranges. Whether offers inside those ranges differ by location is something posting data cannot show.
Finding 3: range width, and what a pay-transparency range is worth
The pay ranges in this dataset exist because of state law. California requires an employer with 15 or more employees to include the pay scale for a position in any job posting, and defines the pay scale as a good faith estimate of the salary or hourly wage range the employer reasonably expects to pay on hire. New York’s Labor Law Section 194-B applies to businesses with four or more employees and allows the range to be the minimum and maximum annual salary. Washington requires employers with 15 or more employees to disclose a wage scale or salary range on postings that recruit Washington-based employees, including remote work. Colorado’s rules, Rule 4.1.2 of 7 CCR 1103-13, let a posted range run from the lowest to the highest pay the employer in good faith believes it might pay for the particular job.
None of these laws fixes how wide a range may be. The data shows how employers use that freedom. The median posting’s maximum is 1.40 times its minimum, a spread of $81K in dollars. A quarter of postings (25.7%) have a maximum no more than 1.25 times the minimum, and 11.3% have a maximum at least double the minimum.
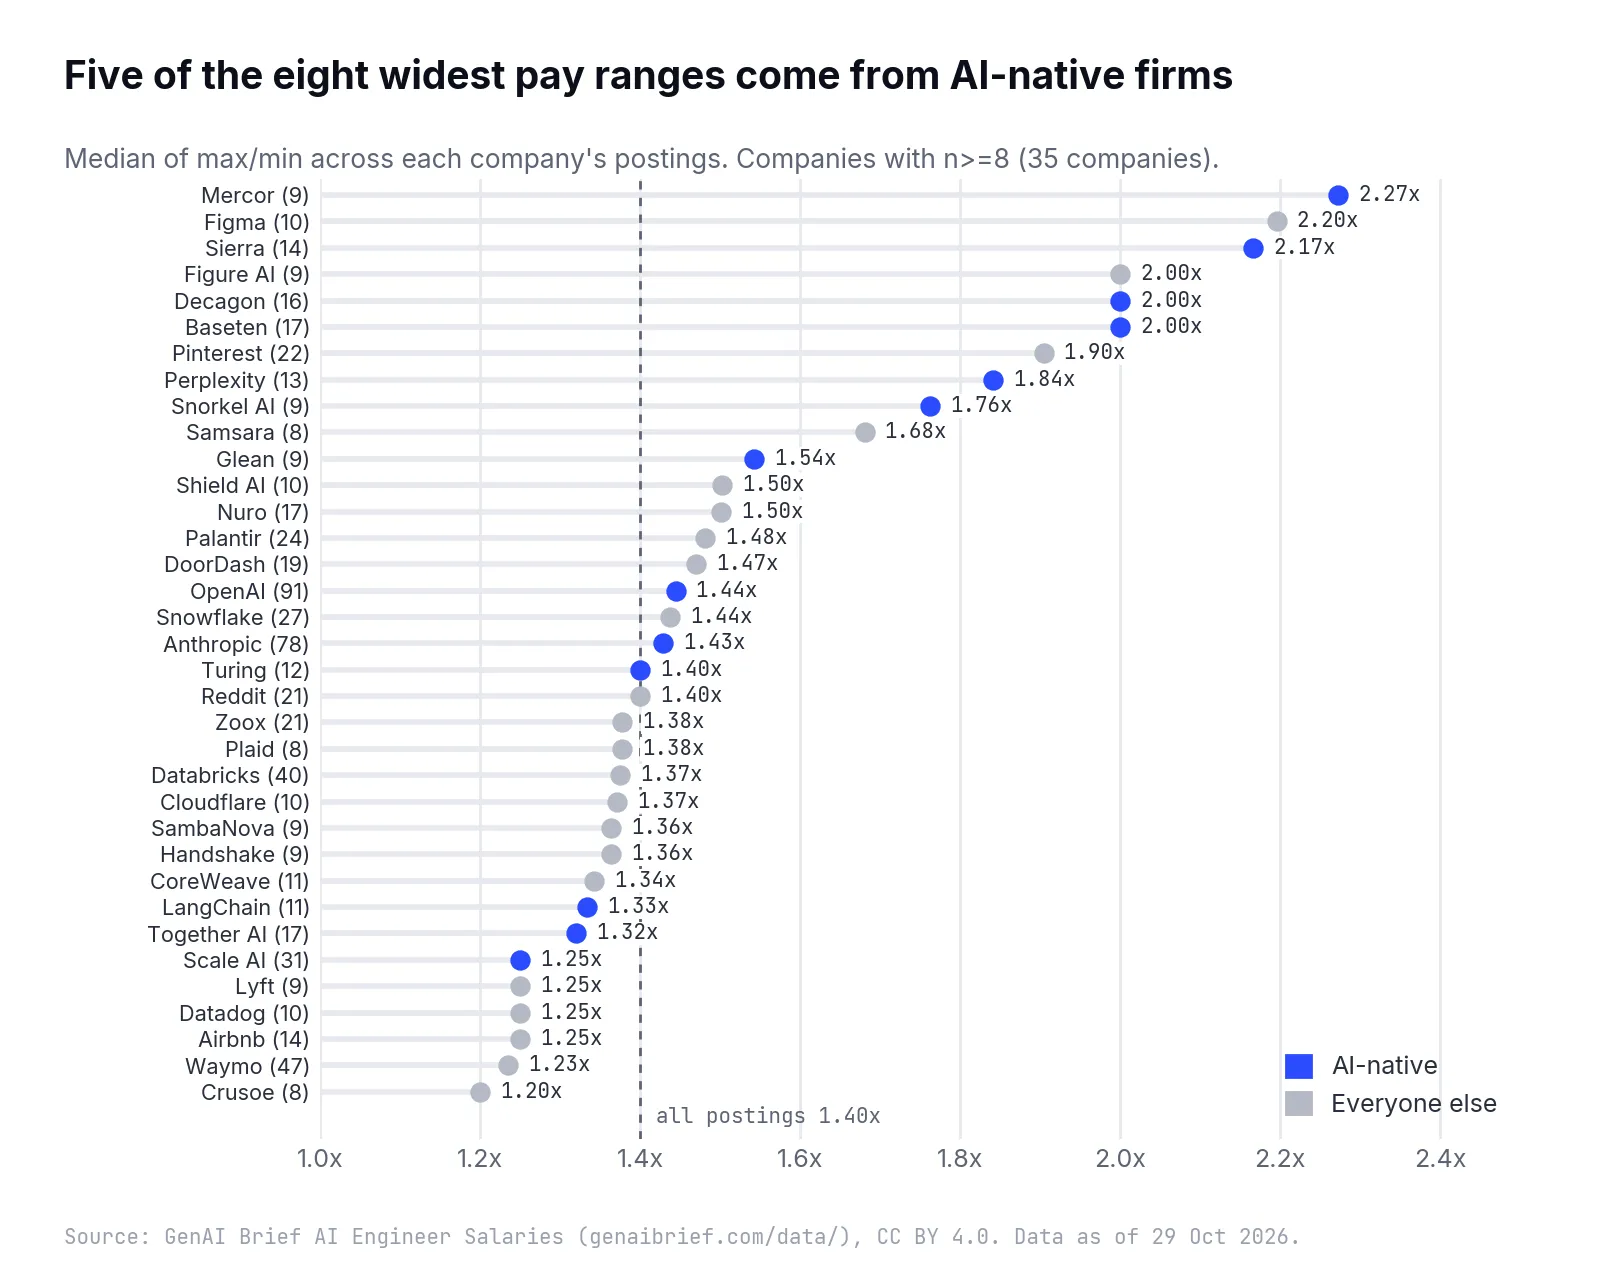
Chart 4: Young AI companies dominate the wide end, but the AI-native group spans the whole scale: Scale AI, Together AI and LangChain post some of the narrowest ranges.
| Widest ranges (n≥8) | Ratio | Narrowest ranges (n≥8) | Ratio |
|---|---|---|---|
| Mercor (9) | 2.27x | Crusoe (8) | 1.20x |
| Figma (10) | 2.20x | Waymo (47) | 1.23x |
| Sierra (14) | 2.17x | Airbnb (14) | 1.25x |
| Figure AI (9) | 2.00x | Datadog (10) | 1.25x |
| Decagon (16) | 2.00x | Lyft (9) | 1.25x |
| Baseten (17) | 2.00x | Scale AI (31) | 1.25x |
Five of the eight widest-ranging companies are AI-native (Mercor, Sierra, Decagon, Baseten and Perplexity at 1.84x); Figma, Figure AI and Pinterest are the exceptions. But three of the eight narrowest are also AI-native: Scale AI (1.25x), Together AI (1.32x) and LangChain (1.33x). The group median ratio is 1.47 for AI-native firms against 1.38 elsewhere, and 1.50 for AI-native firms outside the two big labs.
The wide-range companies share a pattern: they reuse a handful of ranges across many postings. Sierra’s 14 postings use four distinct ranges, among them $180K to $390K and $230K to $390K. Decagon’s 16 use five, including $200K to $400K. Mercor posts ranges such as $180K to $500K and $200K to $500K. Those are not estimates of what one hire at one level will be paid; they span what in a larger company would be two or three levels. Waymo is the opposite case: 47 postings with nine distinct ranges, each narrow, such as $204K to $259K, that read like published salary bands.
Ratios also vary by level. Mid-level postings have the widest median ratio (1.48); this level also collects postings with no level in the title, which may have to cover a spread of candidates. Manager postings (1.29) and the 13 entry-level postings (1.15) are narrowest.
What range width means for a reader
A narrow range is informative: a Waymo or Airbnb posting tells a candidate, within about 25%, what the job pays. A 2x range tells a candidate mainly that the employer has not committed to a level. Colorado’s rule describes a range as the employer’s good-faith estimate for “the particular job”; whether a range that doubles from bottom to top meets that test is for regulators to judge, not us. What the data does show is that the midpoint of a wide range is a weak predictor of a specific offer, so the midpoint comparisons in this piece are more reliable for employers with narrow ranges than for those with wide ones.
Finding 4: what roles and levels pay, once titles are read carefully
Research scientists are the best-paid role family, with a median midpoint of $315K (n=103). The family is dominated by Anthropic (26 postings), OpenAI (15) and Turing (9); outside the two labs the research scientist median is $286.5K (n=62). Forward-deployed and solutions engineers are the lowest-paid family at $225K (n=110).
| Role family | Postings | Median midpoint | Largest posters |
|---|---|---|---|
| Research scientist | 103 | $315K | Anthropic 26, OpenAI 15, Turing 9 |
| AI security | 30 | $286K | OpenAI 5, Anthropic 4 |
| AI engineer | 210 | $265K | OpenAI 36, Anthropic 26, Sierra 13 |
| ML engineer | 161 | $265K | Waymo 27, Pinterest 18, Zoox 14 |
| Prompt / LLM engineer | 8 | $260.7K | Waymo 4 |
| Applied scientist | 16 | $253.5K | spread thinly |
| AI infrastructure | 194 | $250.7K | Anthropic 14, OpenAI 13, LangChain 11 |
| Forward deployed / solutions | 110 | $225K | Palantir 22, Databricks 15, OpenAI 13 |
The AI security premium is real at the top and thin below it. AI security postings have a median of $286K, 10% above the all-postings median, and the titles include safety research, red-teaming, agent security and security engineering for AI products. Nine of the 30 come from Anthropic and OpenAI, including research roles with midpoints of $440K and above. Without those nine, the median is $239.4K (n=21), below the all-postings median. The label “AI security” covers two different jobs: frontier-lab safety research, which is paid like research, and product security engineering, which is paid like engineering. The prompt injection defences most product teams need are mostly the second kind.
Forward-deployed roles sit lowest partly because of a single employer. Palantir posts 22 forward-deployed roles at a median of $167.5K, with ranges from $110K to $147K at the bottom to $145K to $200K at the top. Without Palantir, forward-deployed postings have a median of $239K (n=88). Palantir’s titles span new-graduate and government roles, so the comparison with OpenAI’s or Databricks’ forward-deployed engineers is not like for like. The work these engineers do, wiring models into customer systems and building the harness around an agent, is in demand everywhere; this dataset cannot say whether the lower median reflects the work, the employers or the levels.
Why “mid” out-earns “senior” in this data
The dataset infers level from the title. A posting titled “Senior ML Engineer” is senior; “Staff” or “Principal” is staff and above; a title with no level word is mid. That rule works for most employers but not for labs that post without levels. OpenAI has 73 of its 91 postings classed as mid, Anthropic 39 of 78. Those 112 postings are 32% of the 348 mid-level postings, and their median midpoint is $362.5K.
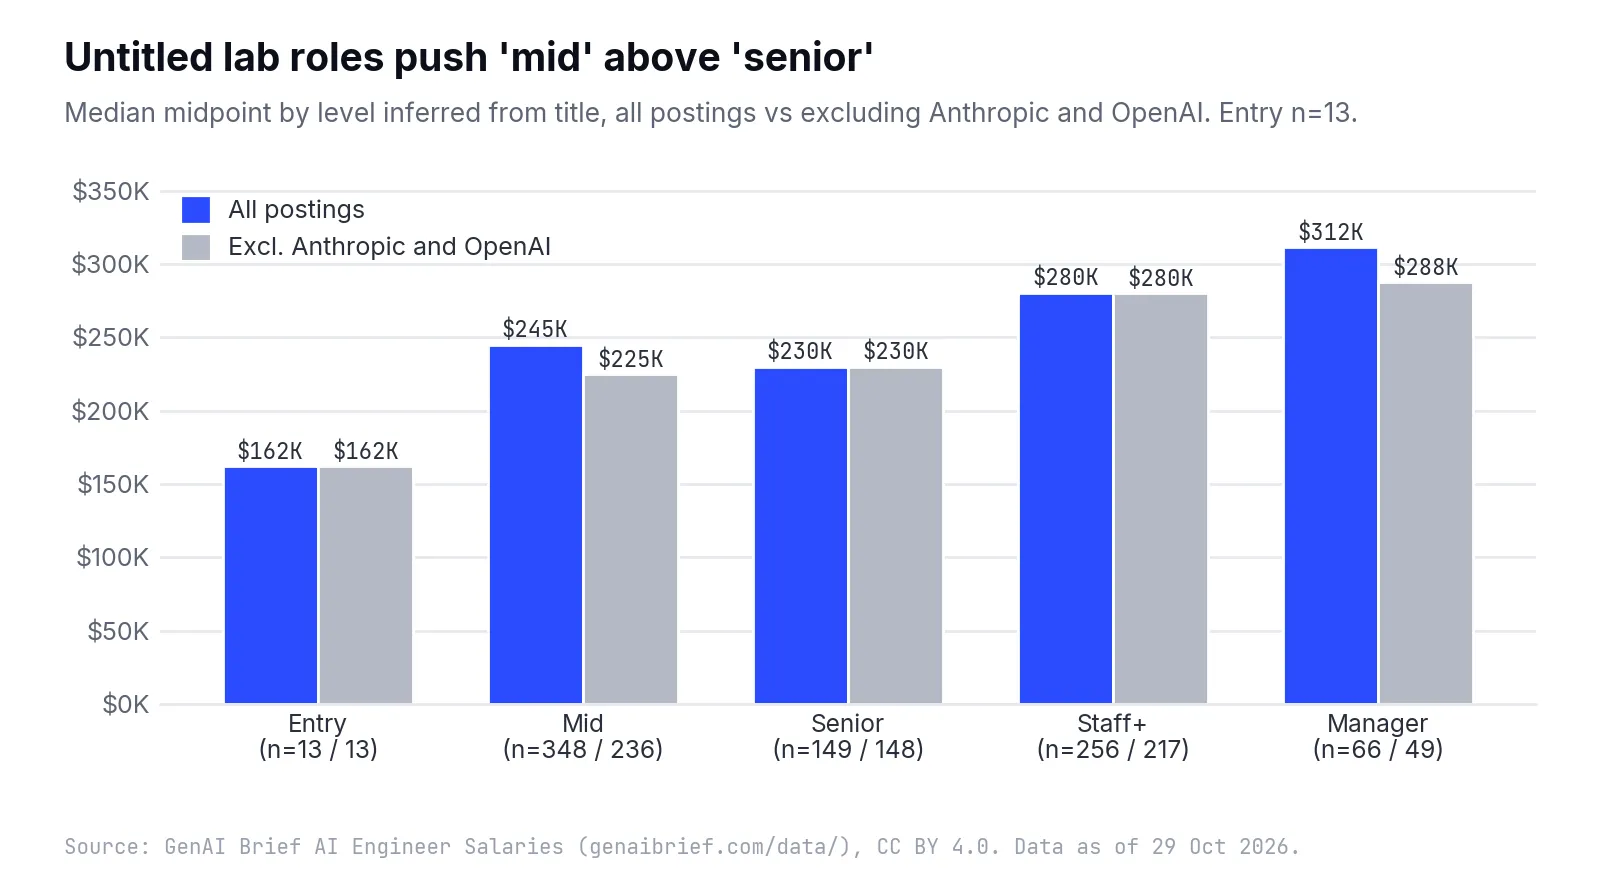
Chart 5: Remove the two labs’ untitled roles and the levels line up in order: mid $225K, senior $230K, staff and above $280K.
| Level | All postings | Excl. Anthropic and OpenAI |
|---|---|---|
| Entry | $162K (n=13) | $162K (n=13) |
| Mid | $245K (n=348) | $225K (n=236) |
| Senior | $230K (n=149) | $230K (n=148) |
| Staff and above | $280.5K (n=256) | $280K (n=217) |
| Manager | $311.5K (n=66) | $287.6K (n=49) |
So “mid” in the raw data mixes true mid-level roles with unlevelled lab roles that often pay like staff roles elsewhere. Even after the correction, the senior premium over mid is small ($5K at the median), which suggests that title words are an imperfect guide across companies: one company’s “senior” is another’s mid level. Entry-level AI roles with published ranges are rare: 13 in the whole snapshot, five of them at Palantir.
Finding 5: state medians follow employers
Among states with at least five non-remote postings, California’s median midpoint is $273.1K (n=461), New York’s $261K (n=54), Massachusetts’ $231.6K (n=10), Colorado’s $224.5K (n=7) and Washington, DC’s $277.5K on five postings. Washington State is the outlier at $167.5K (n=27).
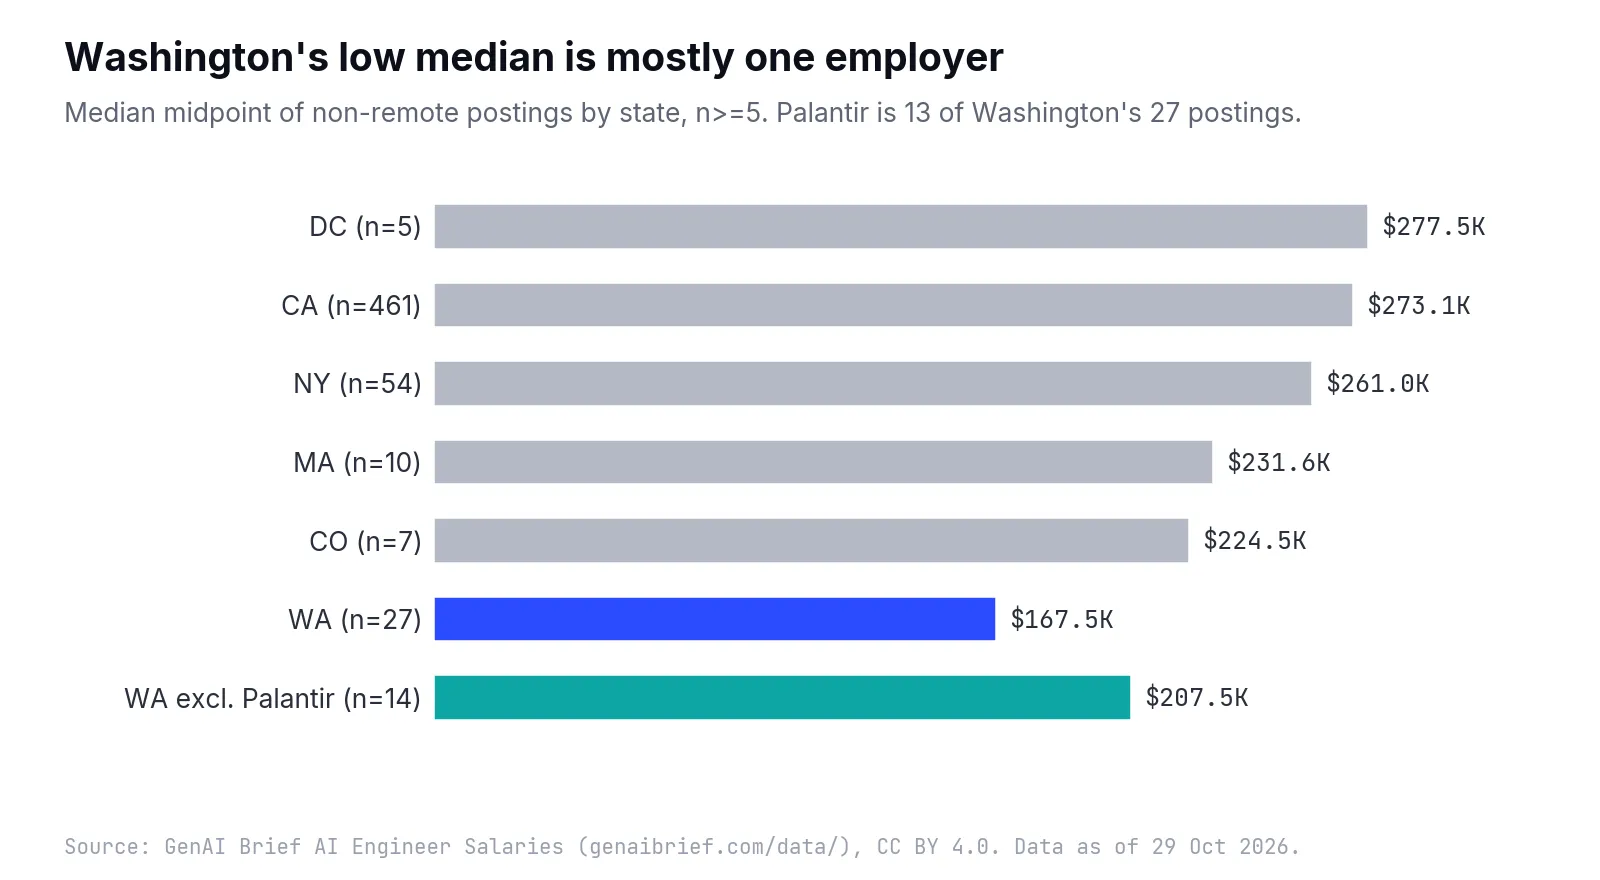
Chart 6: Washington’s low median comes from one employer’s forward-deployed roles; without Palantir it rises by $40K.
| State | Postings | Median midpoint | Largest posters |
|---|---|---|---|
| California | 461 | $273.1K | Anthropic 61, Waymo 47, OpenAI 37, Scale AI 22 |
| New York | 54 | $261K | Anthropic 9, Datadog 7, Palantir 7 |
| Washington | 27 | $167.5K | Palantir 13, Databricks 4 |
| Washington excl. Palantir | 14 | $207.5K | |
| Massachusetts | 10 | $231.6K | LangChain 4, Suno 4 |
| Colorado | 7 | $224.5K | Scale AI 3, Gusto 3 |
| Washington, DC | 5 | $277.5K | Anthropic 3 |
Washington’s sample is small and dominated by one company: 13 of its 27 non-remote postings are Palantir’s, all at a $167.5K median, and 14 of the 27 are forward-deployed roles. Only one Washington posting comes from an AI-native firm (4%), against 48% in California and 50% in New York. Without Palantir, Washington’s median is $207.5K on 14 postings, still below California and New York but not dramatically so for a sample that small. None of this says Seattle-area AI engineers are paid less; it says the employers who posted Washington roles with ranges on 29 October were a particular mix. Large Seattle-area employers are not in the dataset’s company list.
California and New York are closer than the raw medians suggest. Without Anthropic and OpenAI, California’s median is $245K (n=363) and New York’s $232.5K (n=45). Within a single employer the comparison is cleaner but thin: Anthropic’s California postings have a median of $402.5K (n=61), its New York postings $347.5K (n=9), With 9 postings in New York, that is not a basis for a geographic pay differential.
How these numbers compare with the national picture
The US Bureau of Labor Statistics puts the median annual wage for software developers at $135,980 in May 2025, with the top 10% earning more than $214,670, and the median for computer and information research scientists at $140,300. The $260K median posted midpoint in this dataset is 1.91 times the software developer figure and 1.85 times the research scientist figure. 77% of postings have a midpoint above the BLS top-decile threshold for software developers, and 46% have a posted minimum above it.
That comparison is directional, not exact. BLS measures what all employed developers earn nationwide; this dataset measures what a selected set of well-funded, mostly Californian employers advertise for open AI roles. The gap tells a reader that the AI roles in this sample are priced in the top tail of the developer labour market, which is consistent with how companies describe the scarcity of this work. It does not say that the typical AI engineer in the US earns $260K.
What the data cannot tell us
It is a snapshot. All 832 postings were live on 29 October 2026. The dataset cannot show trends, and nothing here should be read as “AI pay is rising” or “falling”.
It is a curated sample, not a census. It covers 74 companies whose public job boards the dataset reads, and only postings that publish a US dollar range. Companies that post on other systems, or do not publish ranges, are absent. Several large technology employers are not in the company list at all, which matters most for the Washington and state comparisons.
It over-represents California and the two big labs. 70% of postings are in California, and Anthropic and OpenAI supply 20% of all postings and 43% of AI-native ones. We have shown each finding with and without the two labs for that reason.
It is base pay only. Equity, bonus and benefits are excluded. At AI labs and late-stage startups, equity can be a large share of total compensation, and its value is uncertain. A base-pay premium could understate or overstate the total-pay difference.
Postings are not offers. A posted range is an employer’s good-faith estimate under state law. Where an actual offer lands, and how many postings are filled at what level, is unknown. Companies with many open roles weigh more in every median.
Several fields are inferred. Role family and level come from titles, which employers write differently. The remote flag comes from job boards and, at some boards, includes hybrid roles. “AI-native” is our classification, published in the script so it can be changed.
Small groups stay small. We hide groups with fewer than five postings in charts, as the dataset page does, and flag anything between five and ten in the text. The Applied scientist remote comparison (6 vs 10), Washington excluding Palantir (14) and Anthropic’s New York postings (9) are all thin.
Correlation is not causation. The AI-native premium describes how two groups of employers post. It does not show that working at an AI-native company causes higher pay for the same person, or why those firms post more.
How to check our numbers
Every figure in this article is printed by one script, and every chart is written by it:
python3 scripts/research/ai-engineer-salary-analysis-2026.pyThe script reads src/data/datasets/ai-engineer-salaries.json, the same 832 rows published on the AI engineer salaries page and as the CSV download. To reproduce in a spreadsheet:
- Salary is
(salary_min + salary_max) / 2for each row; all medians are across rows. - AI-native is the 30-company list in the table above (also the
AI_NATIVEset in the script); borderline is CoreWeave, Crusoe, Lambda, SambaNova, Waymo, Zoox, Nuro, Shield AI and Figure AI; everything else is other tech. “Everyone else” means borderline plus other tech. - Big two means rows where
companyis Anthropic or OpenAI. - Remote uses the
remotecolumn. Explicitly remote additionally requires thelocationto contain “remote” orstateto be empty. - State comparisons use rows where
remoteis false, grouped bystate, as on the dataset page. - Range ratio is
salary_max / salary_minper row; company figures are the median ratio across that company’s rows, for companies with eight or more rows. - Thresholds: role-family and level comparisons need at least five rows in each group being compared; groups below that are excluded from charts and named in the text.
- Regression: ordinary least squares of log midpoint on an AI-native indicator plus role-family, level and California indicators; the premium is
exp(coefficient) - 1.
If you change the company classification, the script reprints every figure. We would like to hear about classifications that change the conclusions.
What this means for builders, hiring managers and founders
If you are an engineer comparing offers, treat the 24% headline as an upper bound. The two biggest labs post far above everyone else; the rest of the AI-native group posts about 9% to 13% above established technology companies for comparable roles, and that premium sits mostly at the top of wide ranges. Ask which level an offer maps to and where in the posted range it falls; at a company posting a 2x range, the midpoint is a poor guide. Remember also that base pay at startups often comes with less liquid equity than at public companies.
If you are a hiring manager outside the labs, the market rate for AI engineers in posted base pay is around $234K to $282K at the median for the AI engineer family, depending on whether you compete with AI-native startups or established companies. The data does not support a remote discount: companies hiring remotely in this sample post national ranges, and candidates can see them. If your ranges are narrow, that is an advantage in credibility; if they are wide, expect candidates to anchor on the top.
If you are a founder pricing your first AI hires, note where the other AI-native firms actually sit. Outside Anthropic and OpenAI, the AI-native median is $260K, the same as the all-postings median. You do not have to match the labs to be in the market; you have to be clear about level and about what the equity is worth. The economics of the product you are building, what it costs to serve each customer, will set how far above that line you can go.
If you are reading salary headlines, check who is in the sample. A median taken across postings is pulled towards whoever posts most, and in AI hiring in late 2026 that means two companies. Medians by state, by level and by role family in this data are all as much about which employers are hiring as about the work itself. We will re-run this analysis as the AI engineer salaries dataset is refreshed, and only then will it be possible to say which of these gaps are durable.
Sources
- AI Engineer Salaries dataset (832 postings, updated 29 October 2026) GenAI Brief
- AI Engineer Salaries, CSV download GenAI Brief
- Occupational Outlook Handbook: Software Developers, Pay U.S. Bureau of Labor Statistics
- Occupational Outlook Handbook: Computer and Information Research Scientists, Pay U.S. Bureau of Labor Statistics
- California Equal Pay Act and pay transparency FAQ California Labor Commissioner's Office (DLSE)
- Pay Transparency (Labor Law Section 194-B) New York State Department of Labor
- Equal Pay and Opportunities Act Q&A Washington State Department of Labor & Industries
- Equal Pay Transparency Rules, 7 CCR 1103-13 (effective 1 January 2024) Colorado Department of Labor and Employment
- Public job posting API Ashby
Frequently asked questions
How much do AI engineers make in 2026?
In 832 US AI and ML job postings with a published range, collected on 29 October 2026, the median midpoint of the posted base-pay range is $260K, and the middle half sits between $217.2K and $307.5K. Postings in the AI engineer role family have a median of $265K (n=210). These are base salaries only; equity and bonus are excluded.
Do AI labs pay more than big tech for AI engineers?
In posted ranges, yes. AI-native companies post a median midpoint of $295.5K (n=389) against $238K (n=443) for everyone else. Most of the gap comes from Anthropic ($402.5K, n=78) and OpenAI ($318.5K, n=91); without them the AI-native median is $260K, 9% above everyone else.
Do remote AI jobs pay less?
Not in this data. Postings flagged remote have a median of $260.1K (n=226) against $260.0K (n=606) for the rest, and the 86 postings whose location explicitly says remote sit at $264.7K. The remote flag includes hybrid roles at some job boards, so treat the comparison as approximate.
Which AI role pays the most?
Research scientist postings have the highest median midpoint at $315K (n=103), followed by AI security at $286K (n=30). Forward-deployed and solutions roles are lowest at $225K (n=110), partly because Palantir posts 22 of them at a $167.5K median.
Why are AI salary ranges in job postings so wide?
The median posting's maximum is 1.4 times its minimum. Several AI startups post much wider ranges: Mercor's median ratio is 2.27x, Sierra's 2.17x and Decagon's and Baseten's 2.0x. Big employers such as Waymo (1.23x) and Airbnb (1.25x) post narrow, band-like ranges. A wide range usually means one posting covers several levels.
Is California the highest-paying state for AI engineers?
Among states with at least five non-remote postings, California's median is $273.1K (n=461) and New York's $261K (n=54); Washington, DC is $277.5K on only five postings. State medians mostly reflect which employers post there rather than local pay levels.
How does AI engineer pay compare with software developer pay?
The $260K median posted midpoint is 1.91 times the US Bureau of Labor Statistics median wage for software developers ($135,980, May 2025). The comparison is loose: BLS covers all developers nationwide, while these postings are AI roles at well-funded companies, mostly in California.